Venture Beacon

Executive Summary
- Stage-dependent performance: Series A and B rounds showed strong valuation growth (1.6%-29%) while Series C financings declined sharply (30%-40%) across key metrics, reinforcing Series C as a critical filtering point for scaling companies.
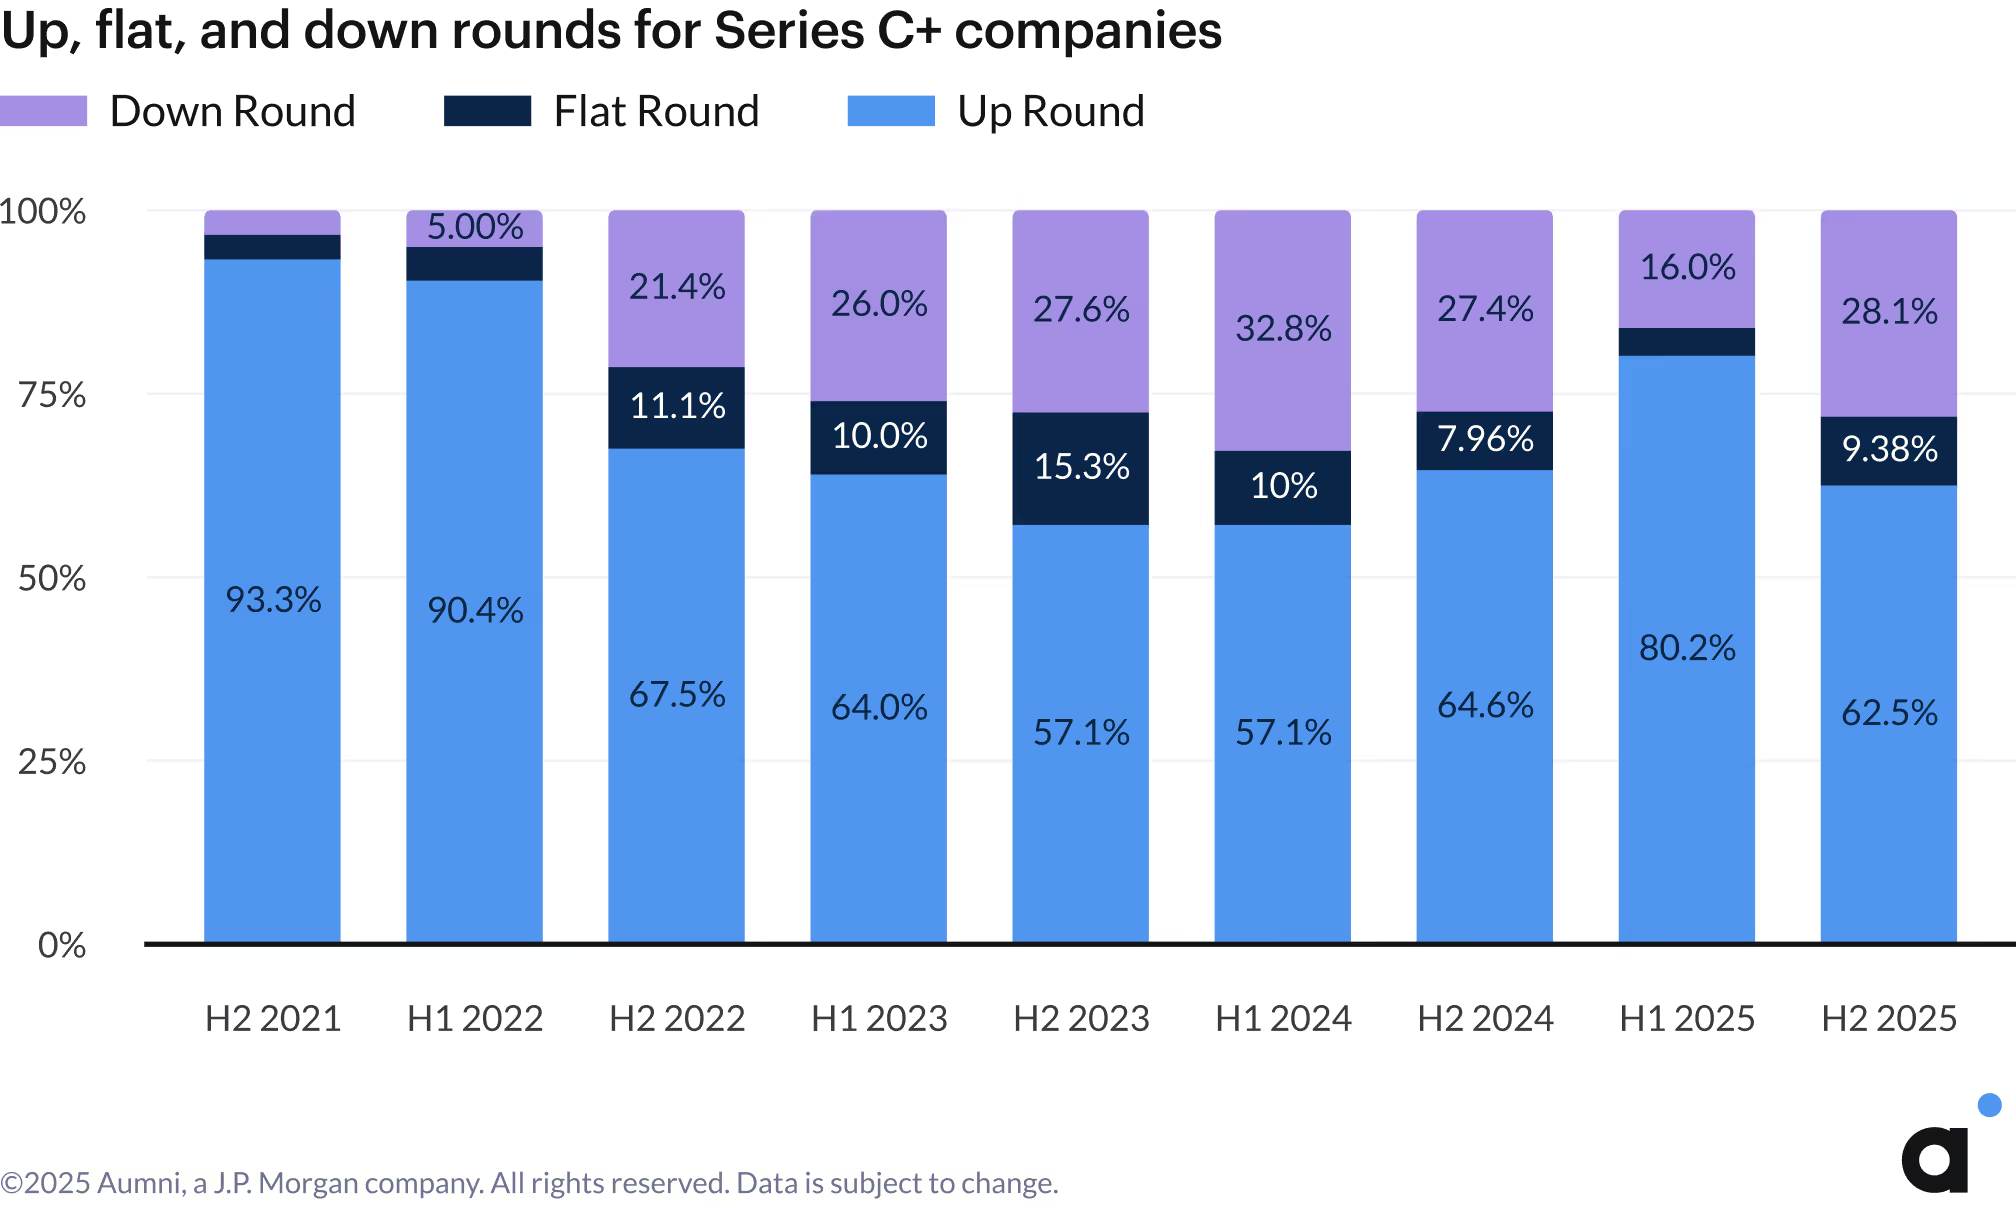
- Late-stage valuation pressure: Series C+ down rounds nearly doubled from 16% in the first half of the year to over 28% in Q3, with increased negative markups in the lower quartile pressuring companies unable to demonstrate sustainable growth.
- AI premium persists: AI companies maintained a 2.5x revenue multiple advantage over non-AI peers (20x vs. 8x), with valuation gaps continuing to widen, though still trailing Nasdaq 100 growth in recent years.
- Consistent deal terms: Liquidation preference multiples above 1x remained rare (<4% of deals), while founder preferred stock increased modestly to just under 10% of companies.
- Secondary market composition shift: An increase in premium pricing in secondary markets reflects a potential flight to quality rather than broad-based appreciation, with preferred stock now comprising 47% of transactions versus 33% in 2024.
- Convertible instrument trends: Investment amounts in SAFEs improved across the board, while convertible notes declined across most ranges, despite higher valuation caps in select brackets.

.avif)
.avif)
.avif)
Foreword

The third quarter of 2025 underscored a venture market that remains active but highly polarized. While overall deal flow and investor engagement stayed steady, the data reveals a widening divergence between early- and late-stage activity. Series A and B financings saw continued resilience, with increases in both capital raised and valuations ranging from 1.6% to 29%, potentially signaling competitive investor dynamics, growing comfort with the macroeconomic environment, and strengthening early-stage fundamentals. In contrast, Series C financings declined sharply across nearly every key metric: capital raised, lead investor check size, and pre-money valuations, which were all down 34% to 40%. Series D+ rounds, meanwhile, showed mixed signals: valuation and capital increases paired with smaller lead investor check sizes, pointing to a greater utilization of investor syndicates.
This stage-dependent split reinforces that Series C continues to be a defining inflection point for companies transitioning from scale-up to growth stage. Investors are rewarding efficiency, revenue pipeline, and fiscal responsibility at the early stage, while applying greater scrutiny to late-stage companies that haven’t yet proven sustainable scaling, consistent performance against KPIs, and financial viability. The result is a venture market that is not contracting, but continuing a focus on fundamentals, a trend we see firsthand in our work with founders and investors navigating financing strategies across all stages of growth.
Regardless of the stage of investment, artificial intelligence continued to be the defining theme of 2025. AI companies maintained a significant valuation premium over non-AI peers across nearly all sectors, with 2.5x higher revenue multiples (20x vs. 8x). That gap widened further this quarter, driven in part by AI’s rapid integration across sectors such as healthcare, where use cases in clinical efficiency, patient engagement, and compliance are driving both investor enthusiasm and tangible results. Yet questions around sustainable AI valuations persist as Series A premiums across most sectors declined as compared to 2024. In light of the variability we’ve seen quarter to quarter this year, we will continue to report on how these market indicators evolve.
Together, these developments paint a picture of a market that supports early-stage experimentation but rewards later stage execution. As investors grow more selective in deploying later-stage capital, companies that can clearly demonstrate durable growth, operational maturity, and measurable impact will continue to command capital.
At Fenwick, we’re proud to partner with Aumni and J.P. Morgan on this data-rich report, which continues to illuminate the dynamics shaping today’s venture ecosystem. We hope the insights in this quarter’s Venture Beacon help founders, investors, and operators navigate what’s next.
.avif)
.avif)
.avif)
.avif)
.avif)

The Venture Beacon
Equity Financing Dynamics
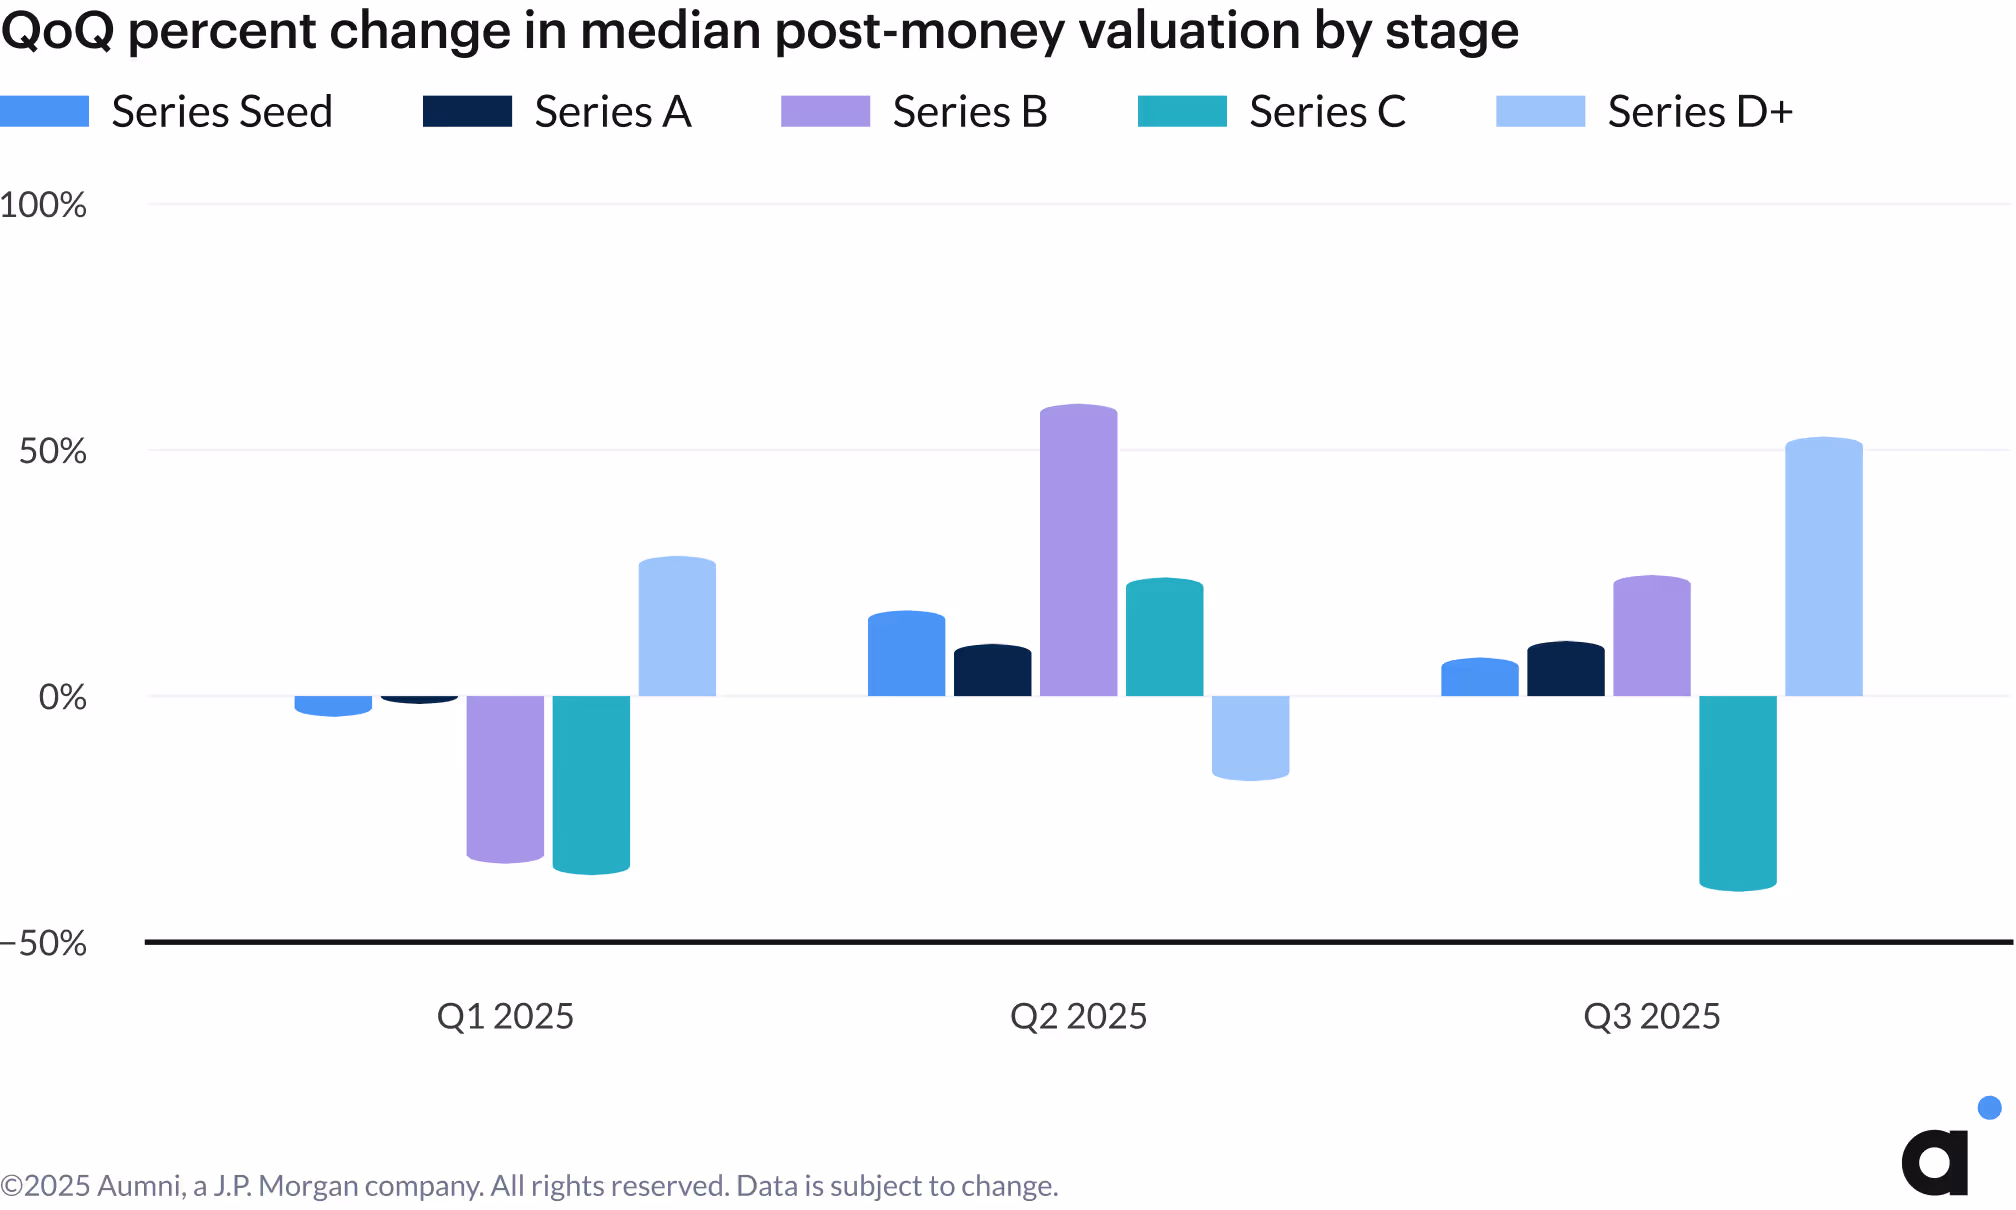
The third quarter of 2025 reinforced a stage-dependent shift in the venture capital landscape, with equity financing performance varying significantly across funding rounds. Series A and Series B financings experienced modest to high increases in both capital raised and valuations between 1.6% and 29%, while Series C financings saw marked declines in capital raised (34%), lead investor check sizes (47%), and pre-money valuations (40%). Series D+ rounds showed increased capital raised and pre-money valuations greater than 30%, but decreased lead investor check sizes by a similar magnitude (27%).
The decreasing lead investor check sizes at Series D+, taken in context with the increase in capital raised, pre-money valuations, and the increased median board size, could be a sign of greater collaboration and co-investing activity in later stage financings. Meanwhile, Series Seed and Series A performance fluctuations are much smaller relative to fluctuations at other stages, suggesting a continued close alignment in company performance, KPIs, investor activity and expectations.
The divergent pattern highlights the market’s selective approach to different maturity stages during the quarter. It further reinforces that Series C is often seen as a natural filtering point, where companies must prove scalability and a path towards viable economics but haven’t yet reached the mature growth stage that attracts later-stage investors which prefer to fund growth pre-IPO.
.avif)
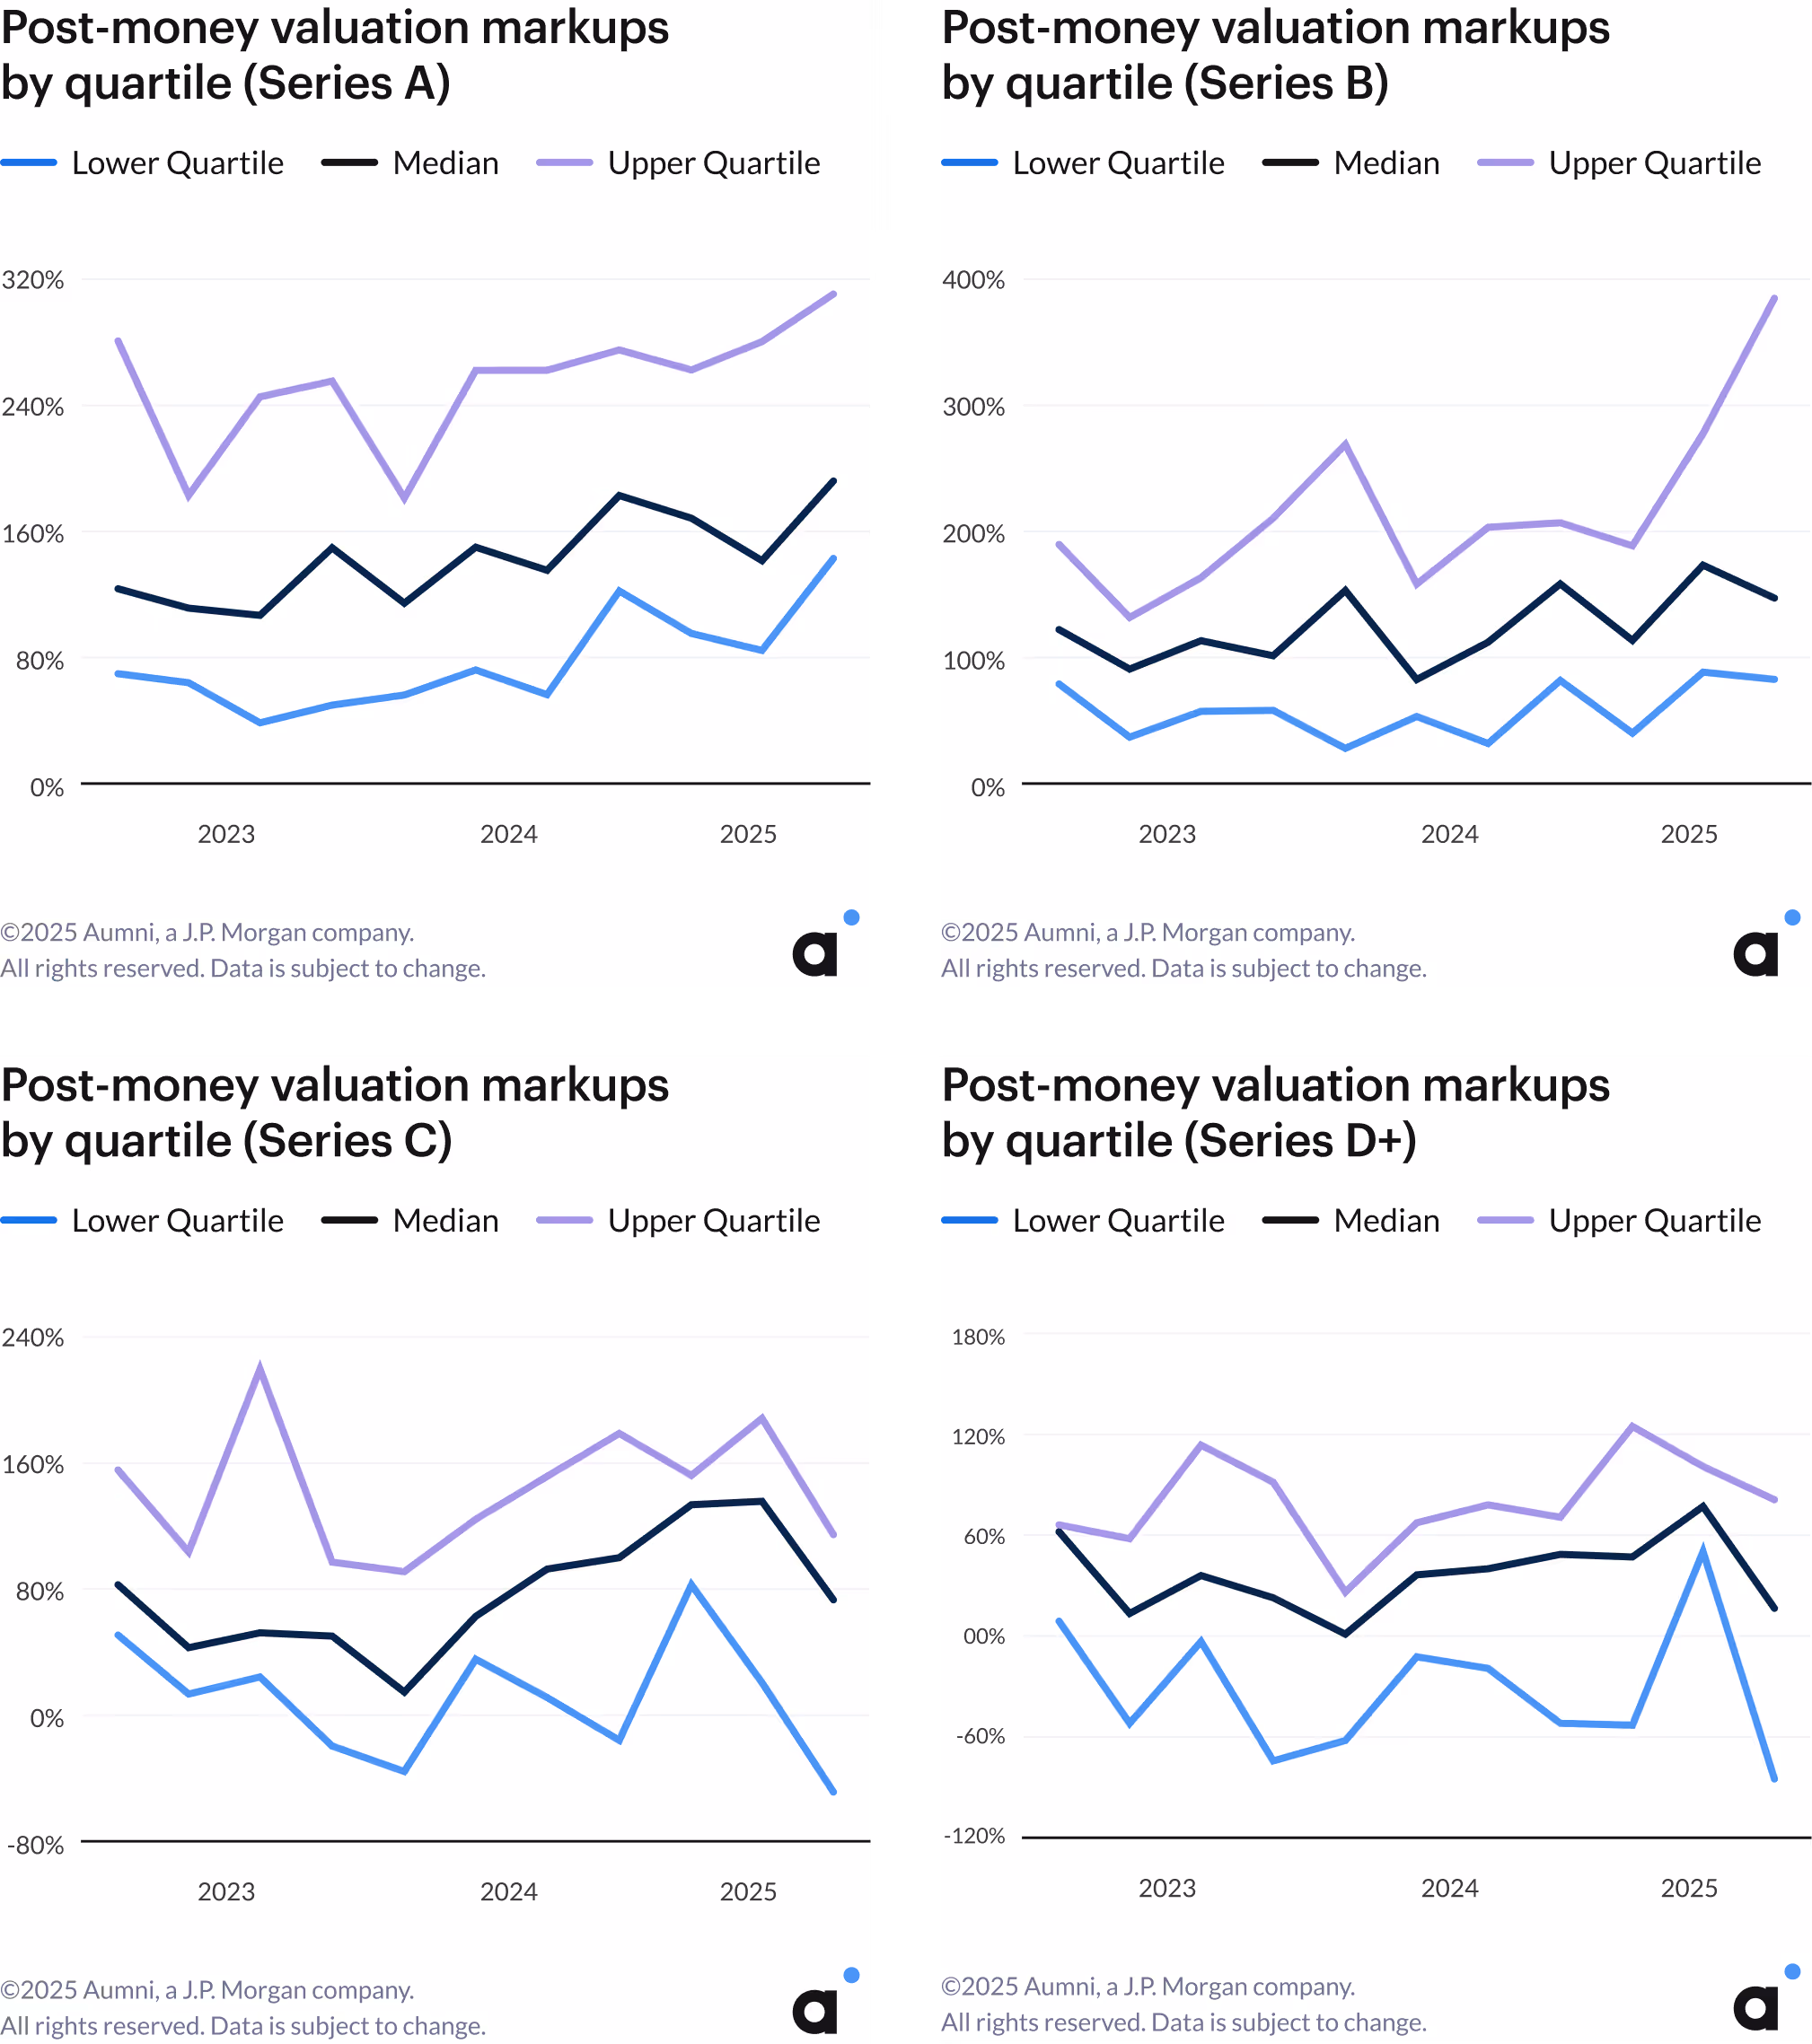
Valuation markup – The percentage change in valuation from one stage of financing to the next, e.g., the change in valuation from Seed to Series A.
Stage-to-stage valuation markups showed mixed results across different investment stages in Q3 2025. The gap between median and upper quartile post-money valuation markups widened for both Seed-to-Series A and Series A-to-Series B step-ups. In Q3 2025, upper quartile Series A markups surpassed 300%, while Series B markups reached nearly 400%.
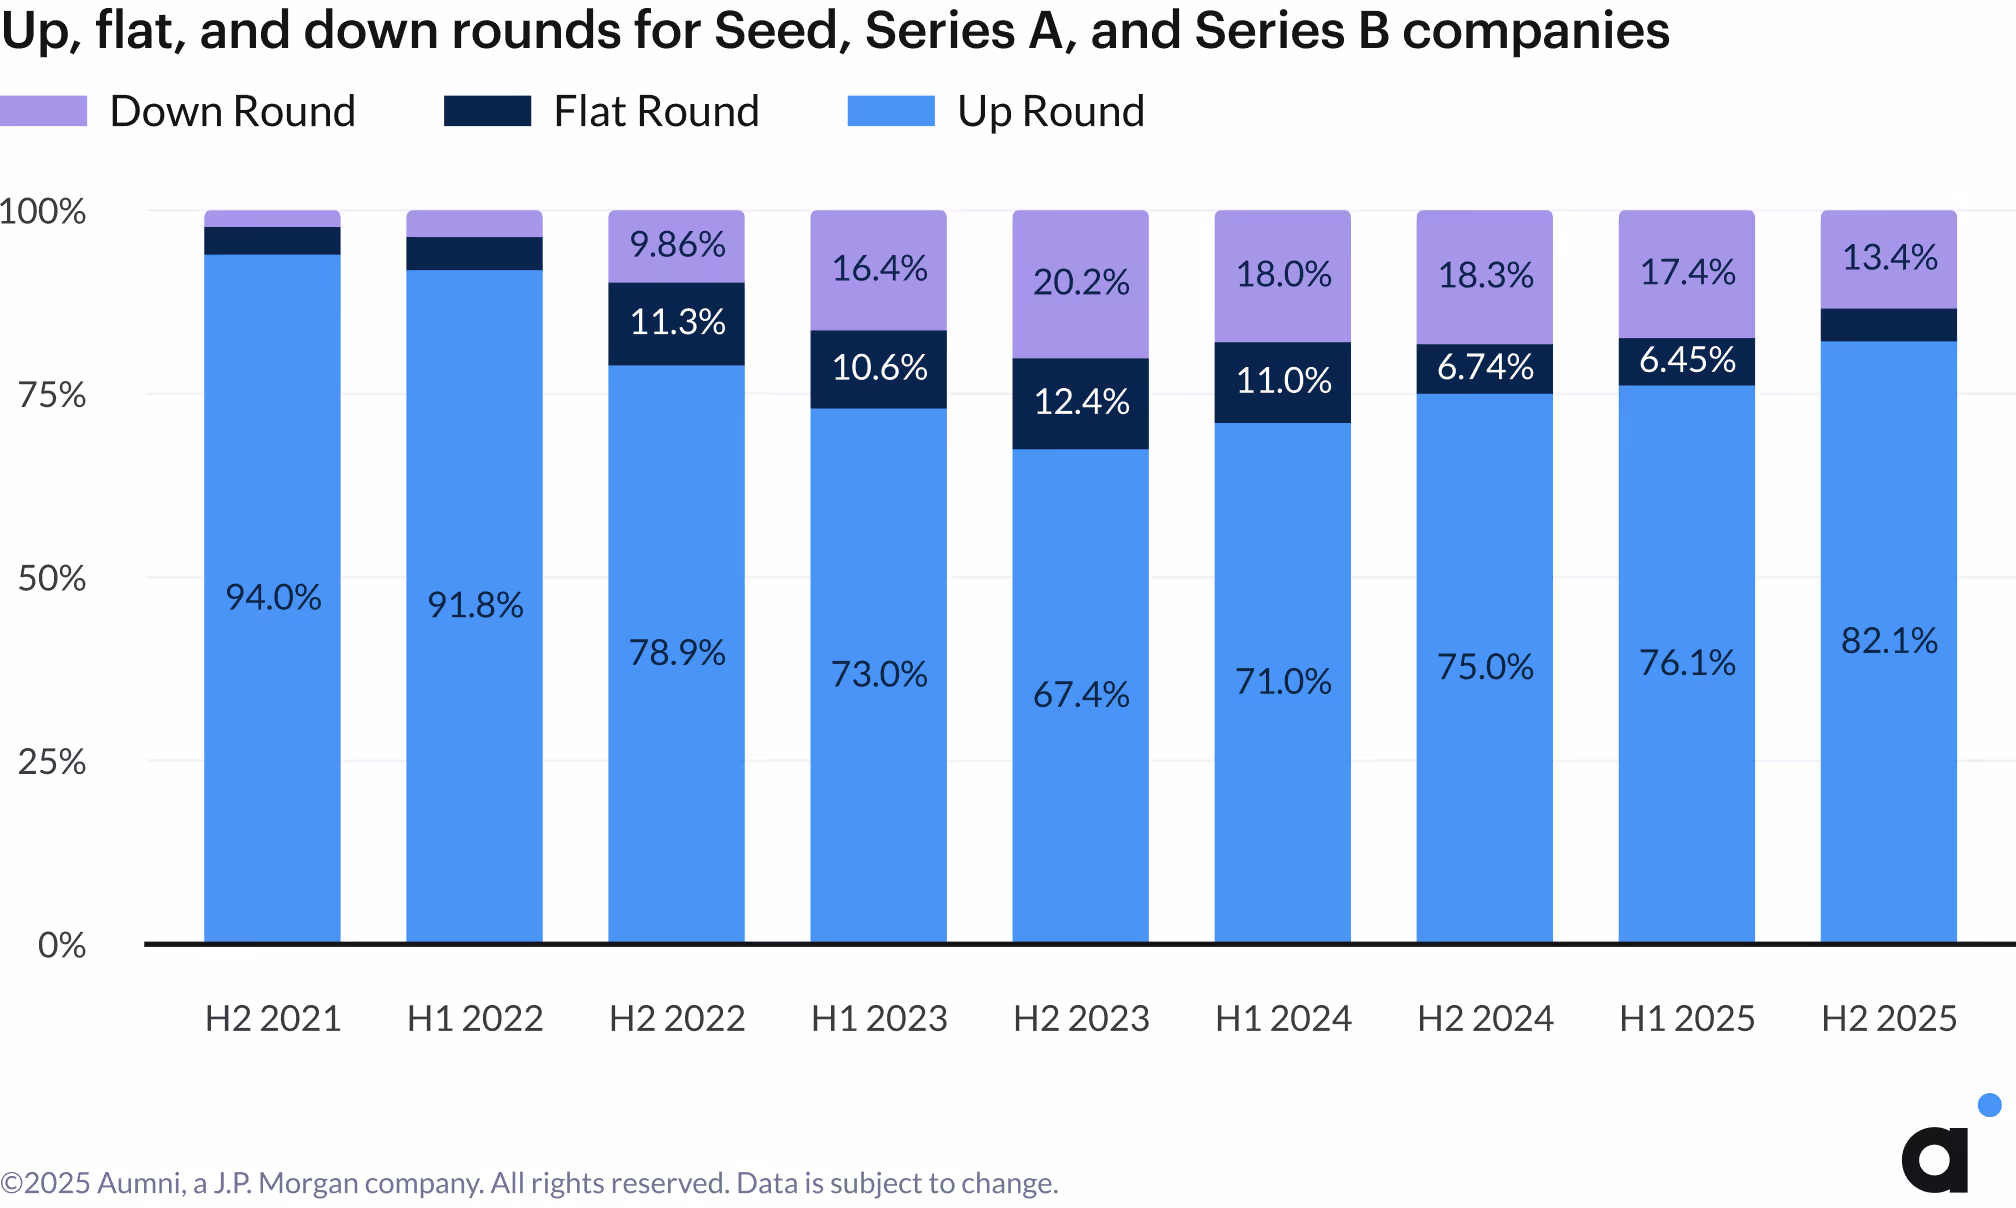
Late-stage equity financing markups, however, declined. The lower quartiles saw a relative increase in negative markups, translating to an increase in down rounds in the second half of the year compared to early-stage financings. Down rounds for Series C+ increased from 16% in the first half of 2025 to over 28% based on data collected in Q3. The story is considerably different for earlier stages, where down rounds decreased to 13.4%, down from 17.4% during the first half of the year. Together, the data suggests companies unable to demonstrate sustainable scaling face valuation pressure starting at Series C, and further highlights the increasing performance gap between top-tier and underperforming companies.

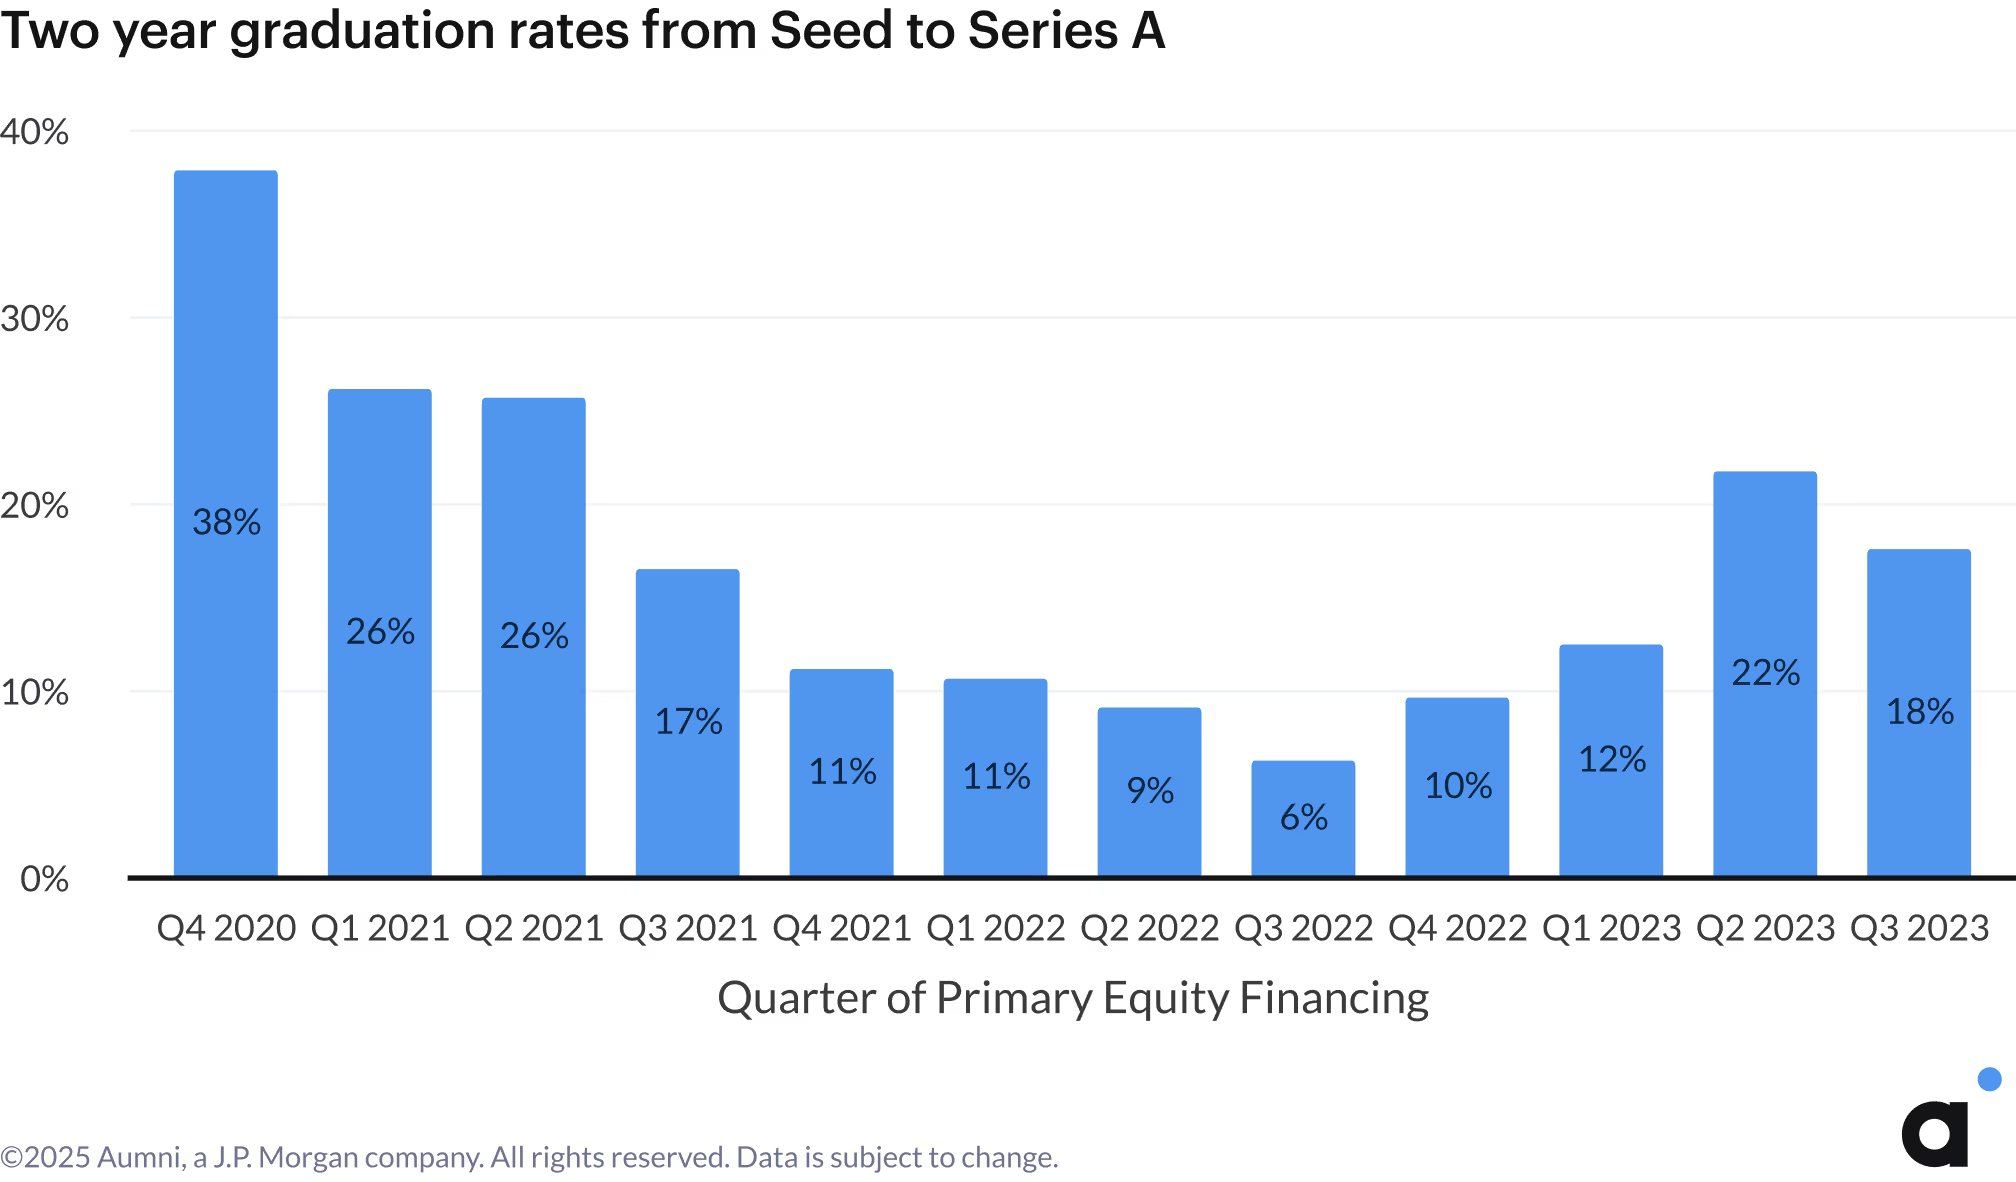
Fundraising timelines improved in Q3 2025, with the median time between rounds declining to 21 months from 23 months the prior quarter. Even though fundraising timelines improved, the Seed to Series A graduation pipeline weakened in Q3. Among companies in Aumni’s dataset that raised a priced Seed round in Q3 2023, 18% successfully raised a Series A in the two years that followed, a decline of 4% from the prior quarter. That said, the graduation rate remains elevated compared to the lower graduation rates observed from the 2022 vintage.
Artificial Intelligence and Revenue Multiples
In Aumni’s taxonomy, Artificial Intelligence ("AI") is considered an applied technology, one that is applicable to any sector in the economy. AI is therefore a distinct category from “Sector.”
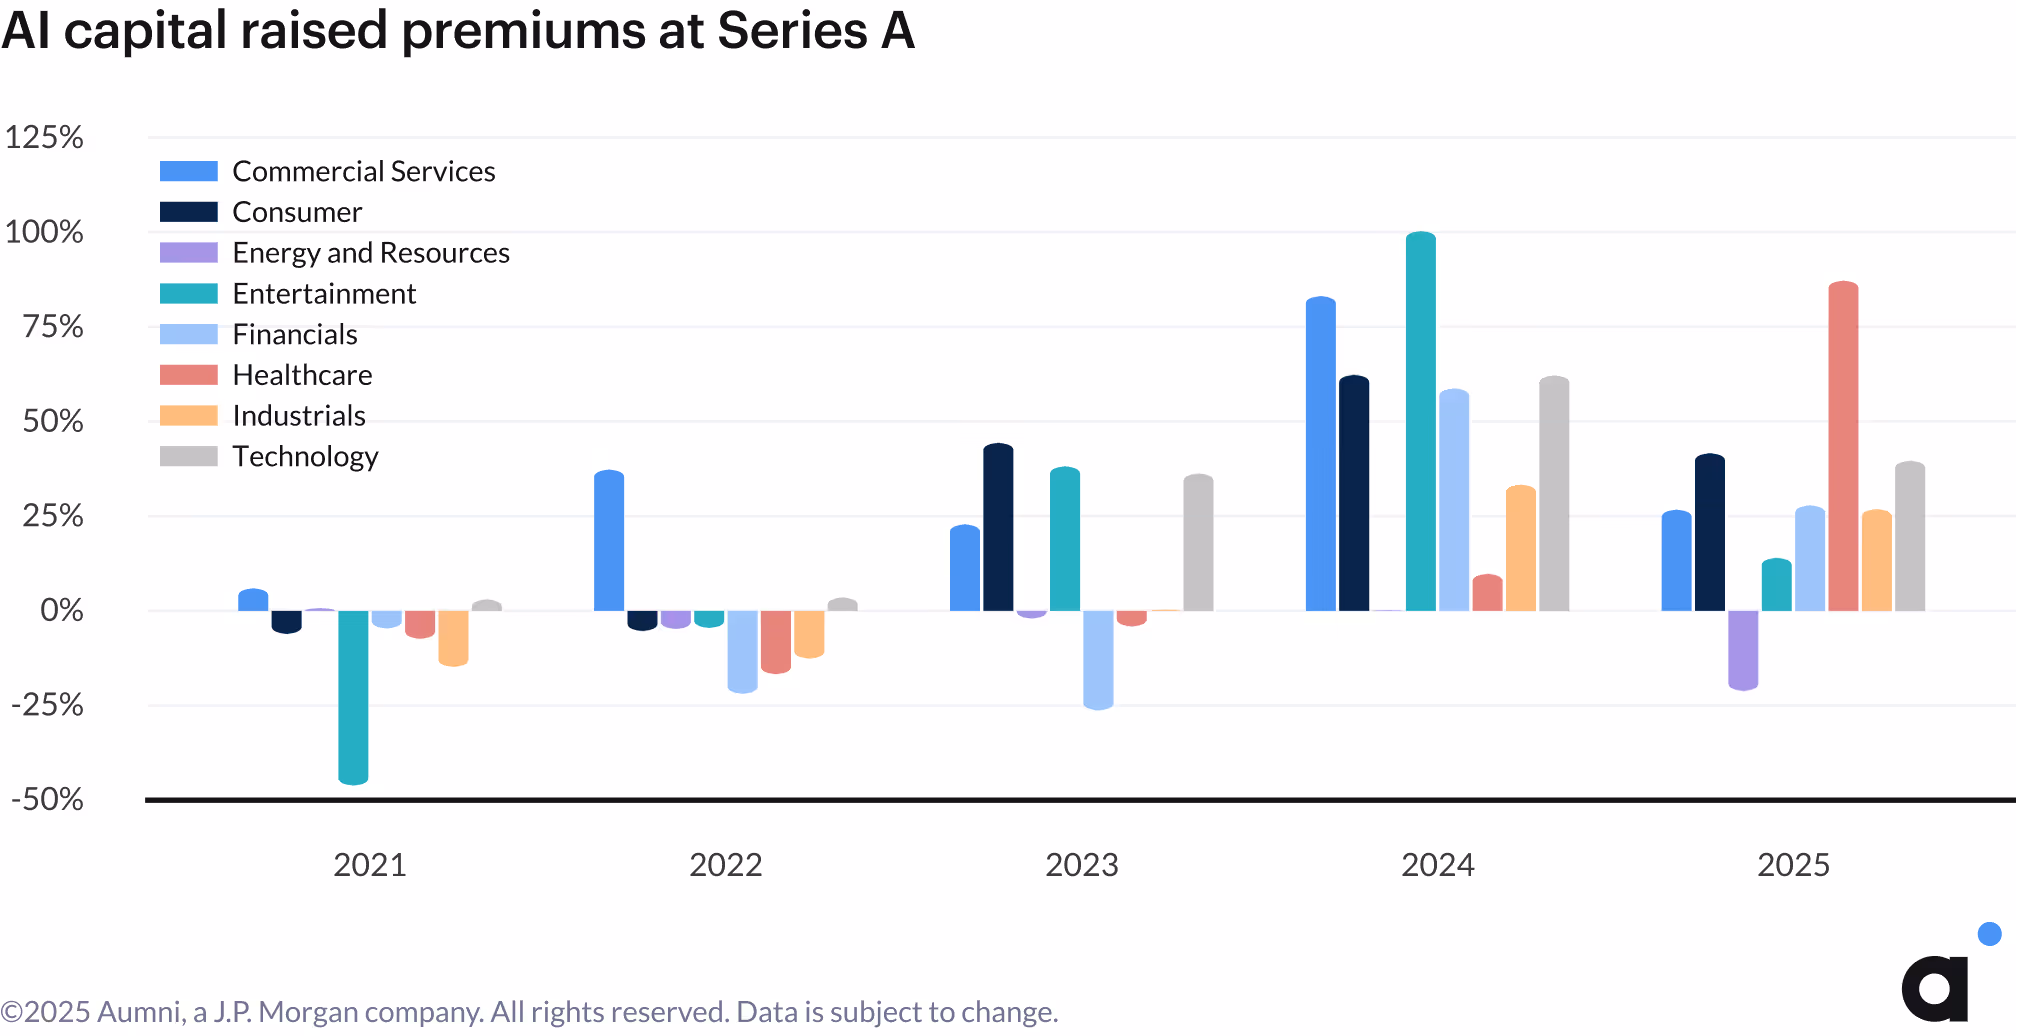
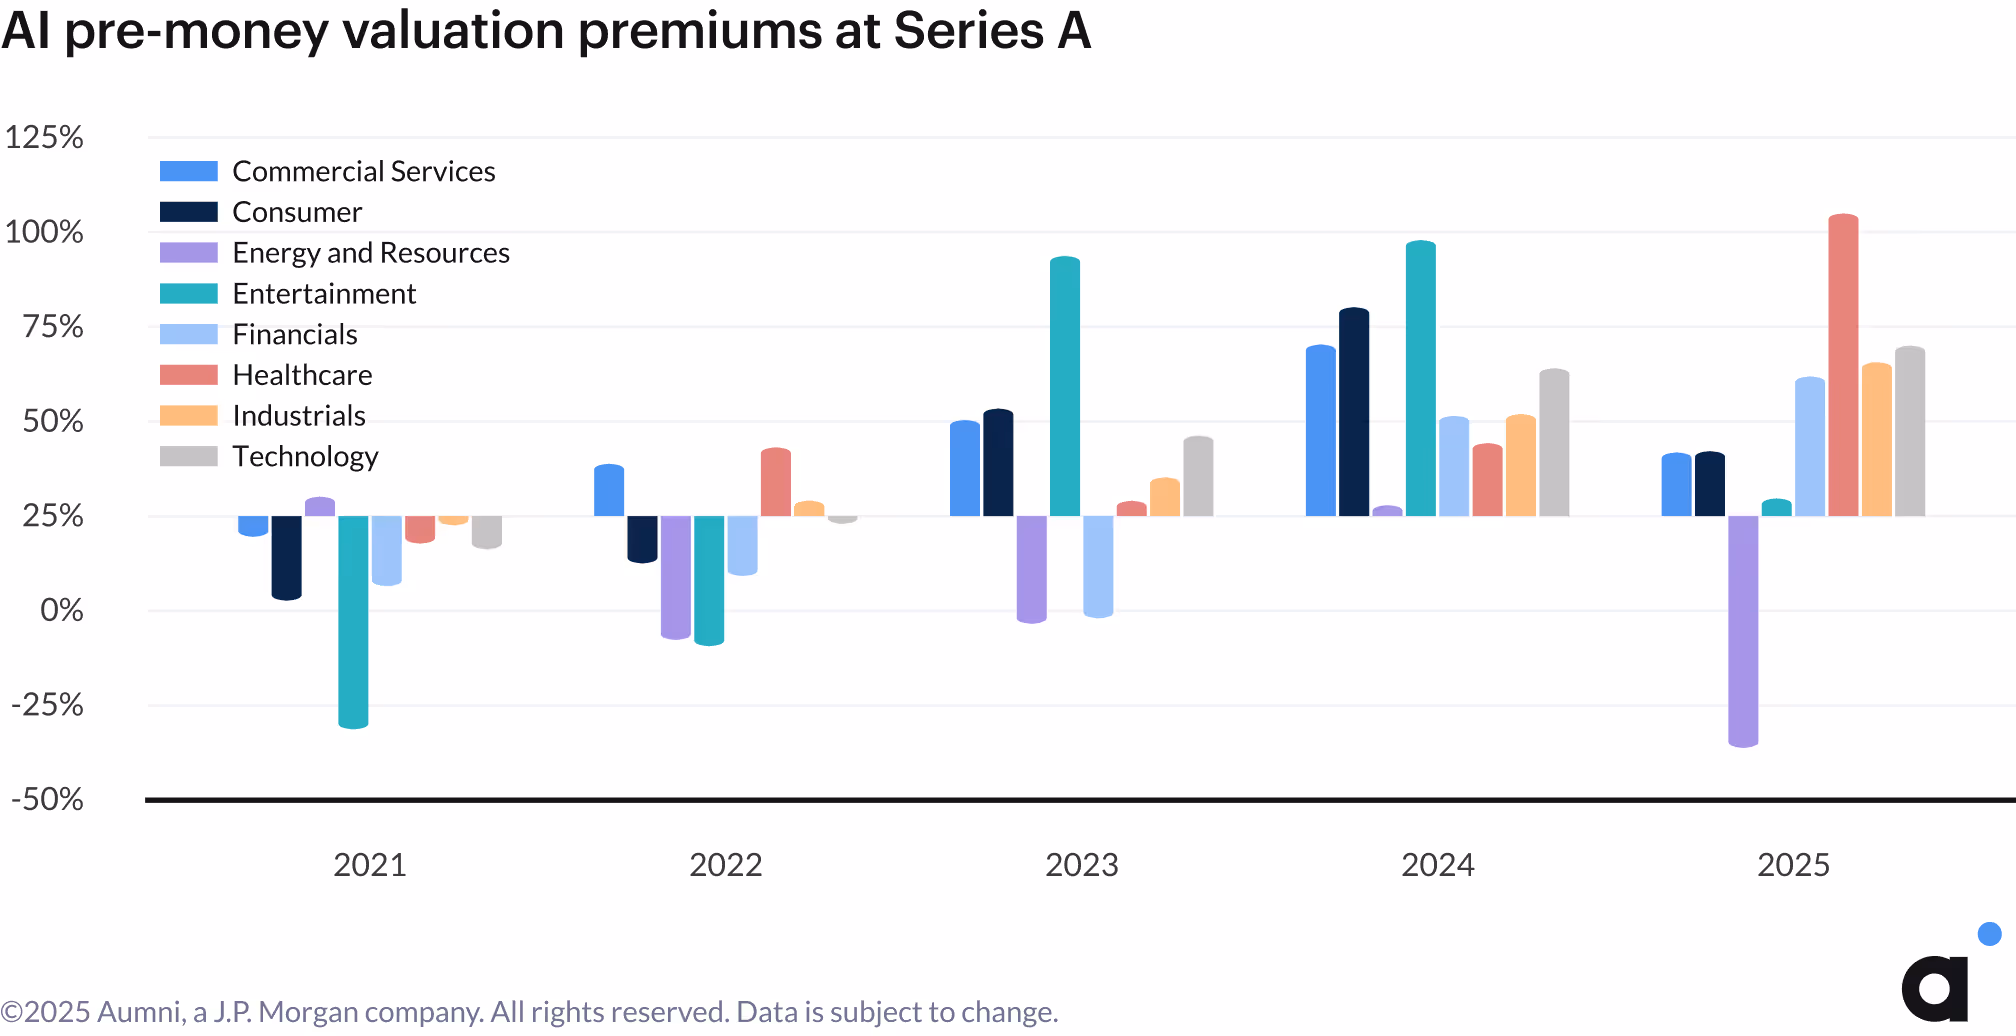
Data through Q3 2025 indicates that valuation premiums for AI companies have strengthened in specific sectors since the first half of the year. Year-to-date, AI companies have on average raised more capital at higher valuations compared to non-AI companies across all sectors, with the exception of Energy and Resources. The healthcare sector's premium performance remains the standout.
Questions about sustainable AI valuations persist, as the technology continues to generate debate and draw concerns from market observers. Taking a longer view of Aumni's venture capital data, the gap between AI and non-AI Series A post-money valuations continued widening through 2025, though notably remaining behind the growth seen in the Nasdaq 100 in recent years.
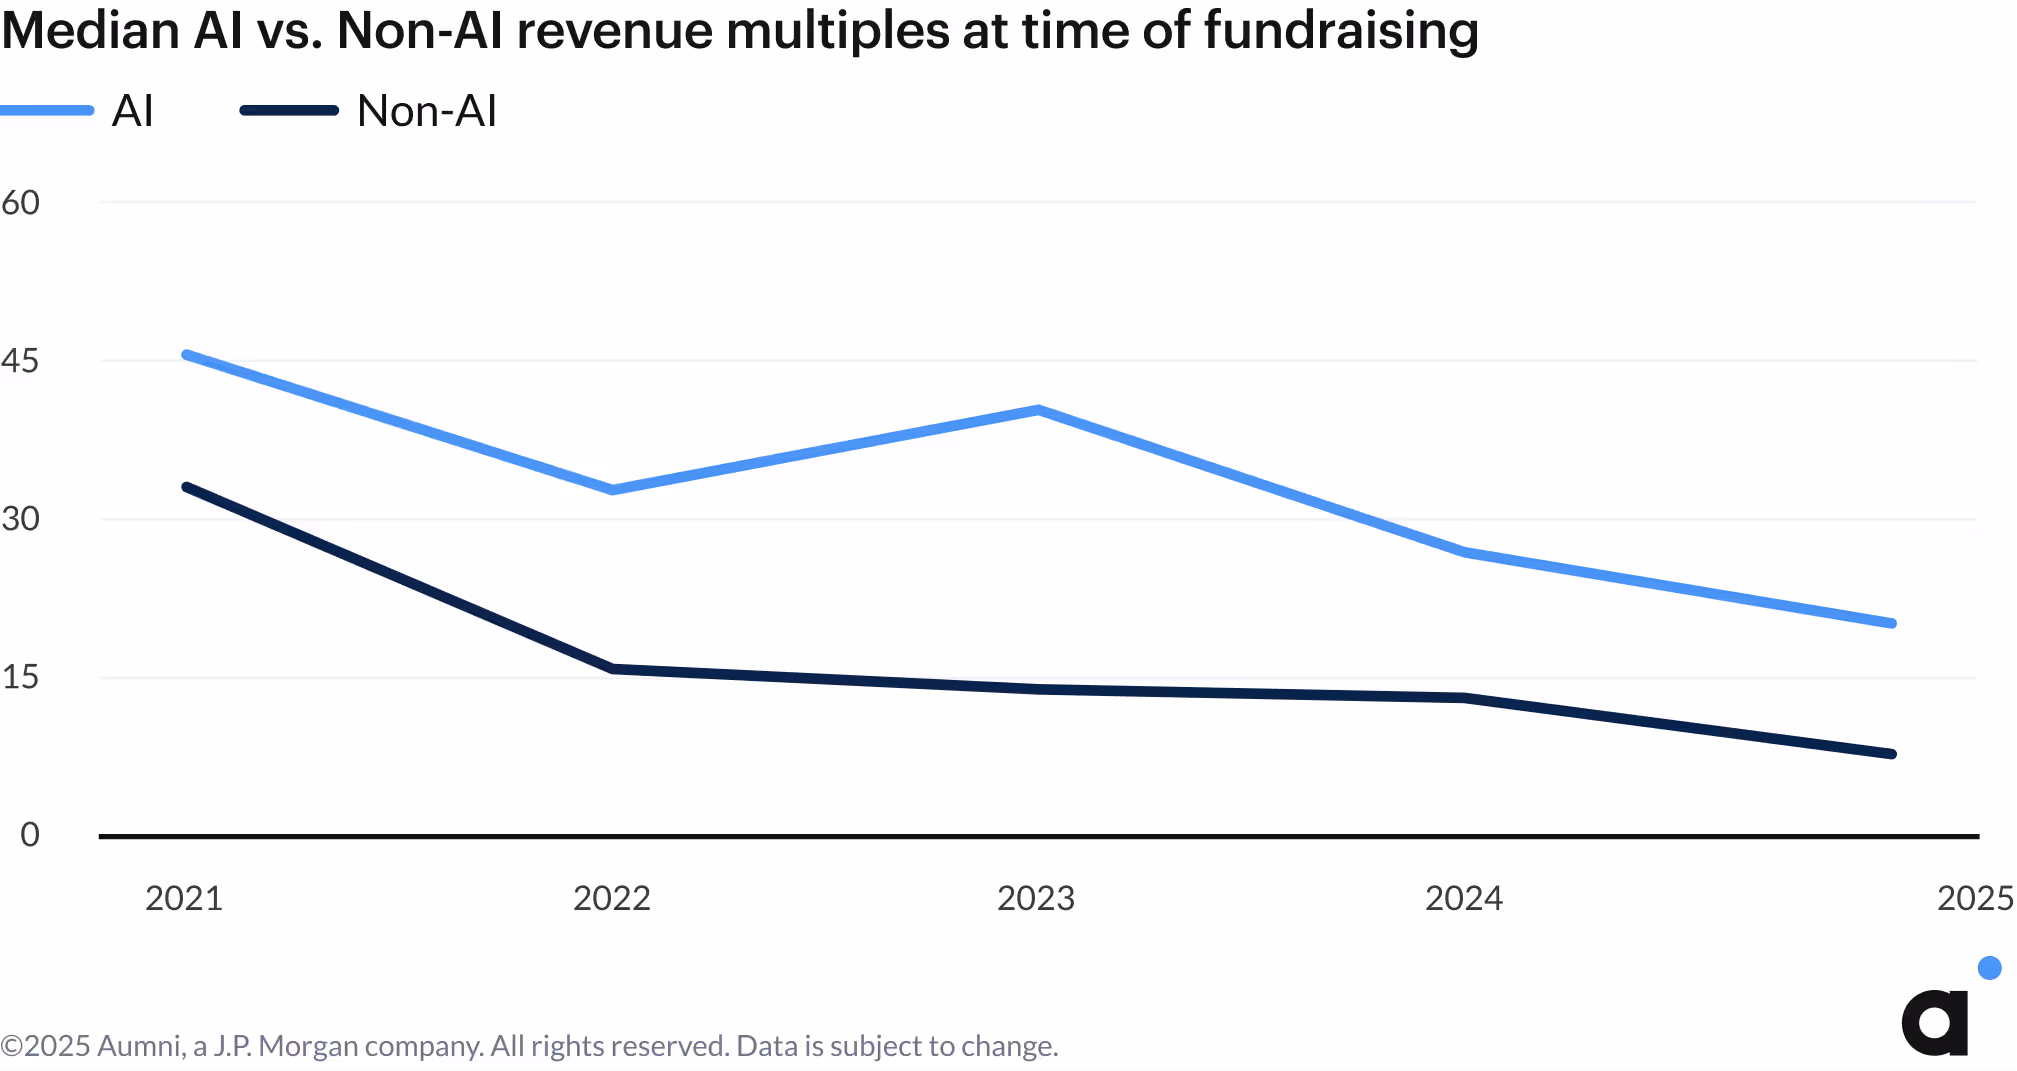
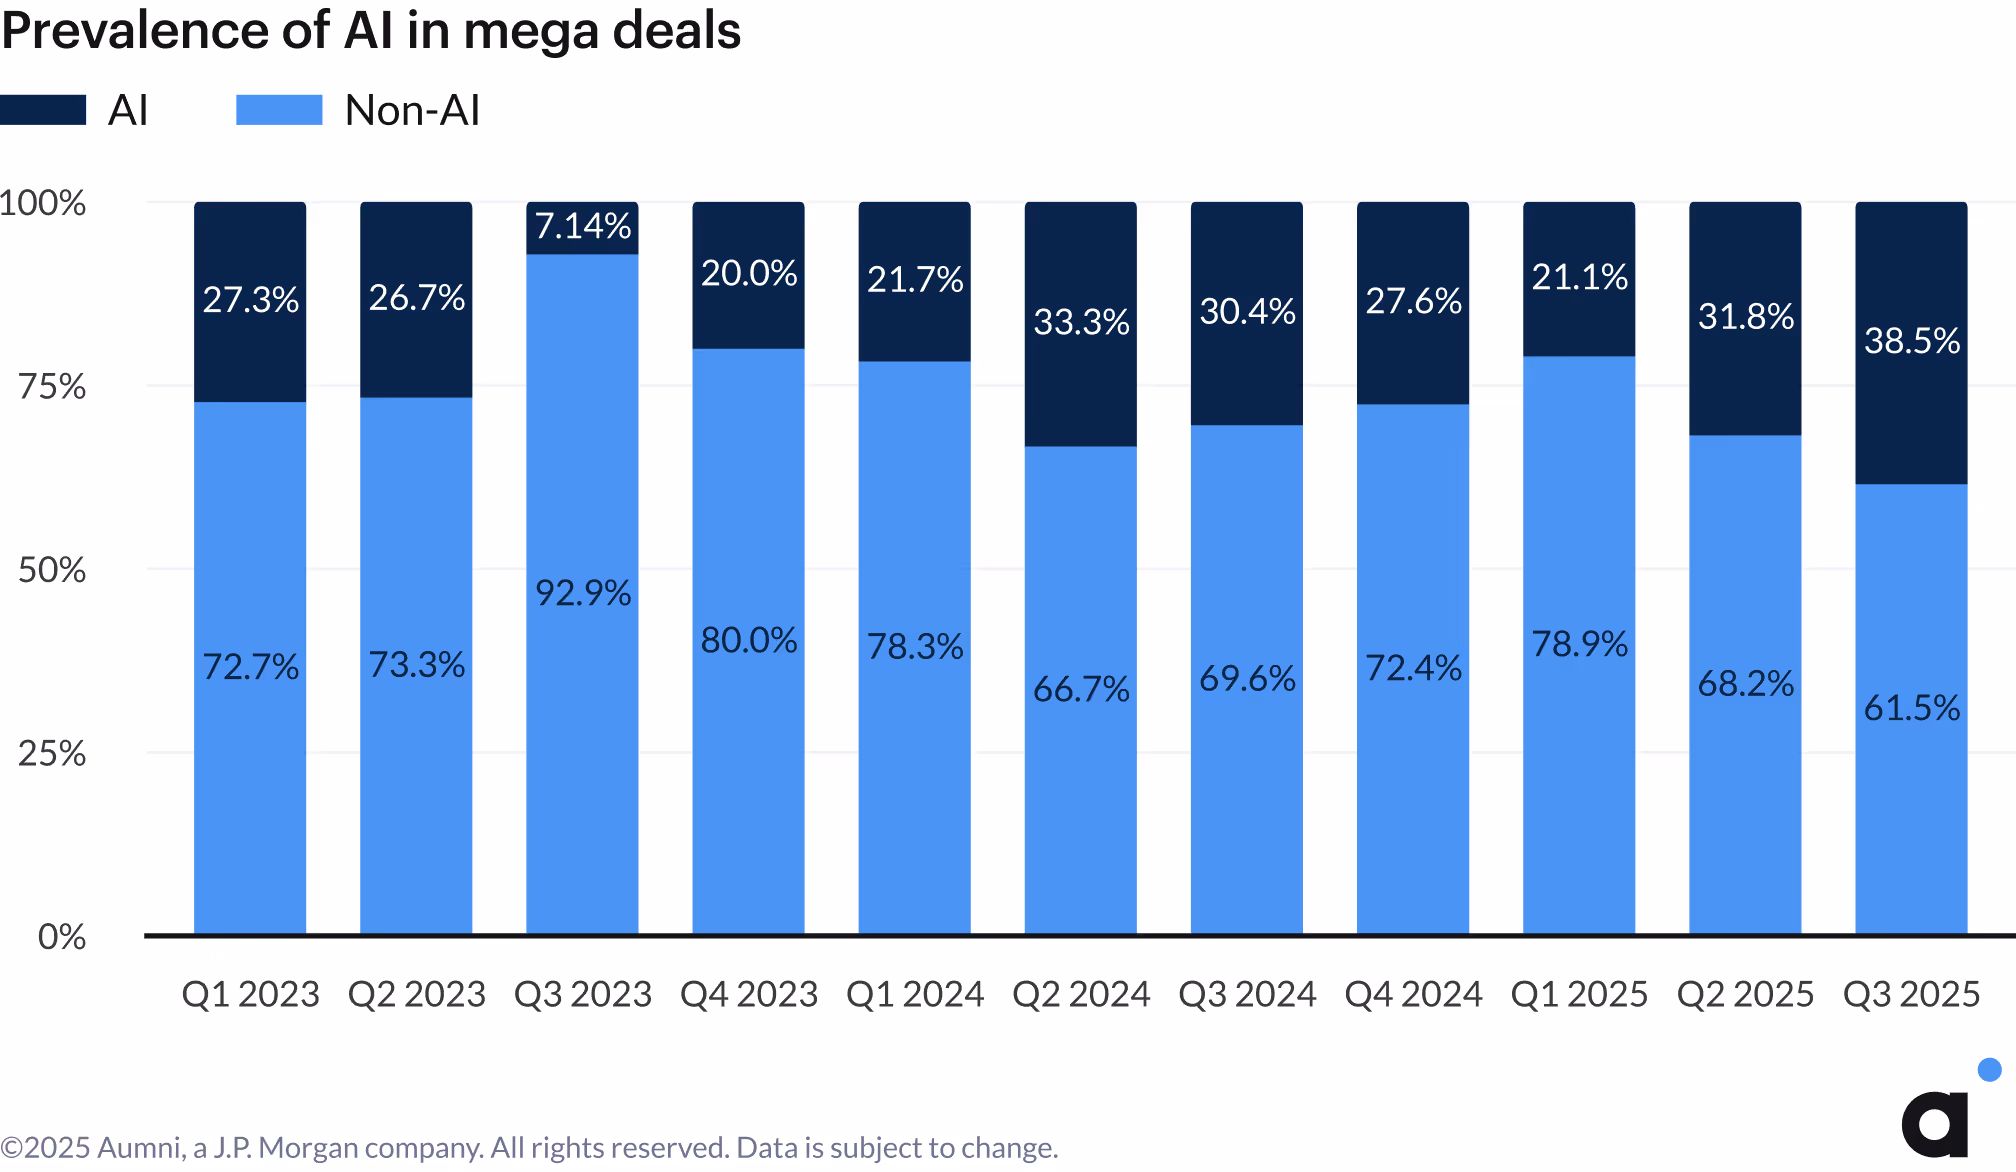
Examining the underlying revenue multiples reveals that AI companies have consistently raised capital at higher revenue multiples compared to their non-AI counterparts. While revenue multiples represent just one metric for evaluating early-stage ventures, the consistent delta between AI and non-AI companies since 2021 is remarkable. As revenue multiples declined from their 2021 market peak, the gap between AI and non-AI companies widened in 2023, before both segments continued to moderate through 2025. Data from Q3 2025 shows that the median revenue multiple for non-AI companies is approximately 8x, while AI companies command approximately 20x. The gap can be partially explained by the increased prevalence of AI in mega deals, equity financing events with a total capital raised of $100M or more.
%201.avif)
Revenue multiples are calculated by dividing a company's pre-money valuation by the simple annualization of quarterly revenue data (multiplying reported quarterly revenue by four) from within the same quarter as the closing date of an executed equity financing event.
Secondary Transactions
Secondary transfer data through Q3 2025 suggests that transaction volume remains muted, but signals a potential flight to quality. While overall secondary transaction volume declined, the proportion oftransactions clearing at a premium to the price per share of the most recent prior round increased to approximately 38%, up from 27% in Q2. This shift toward premium pricing aligns with a notable change in the composition of secondary transactions: preferred stock comprises 47% of transactions in 2025, up from 33% the year prior. Such an increase may suggest that investors are seeking alternatives to traditional M&A or IPO liquidity paths as a means to generate distributions to limited partners. Since preferred stock typically carries enhanced liquidation preferences and protective rights over common stock, it generally commands higher transaction prices. The shift toward more preferred stock trading therefore helps explain the rise in premium pricing.
Founder Preferred and Liquidation Preference Multiples
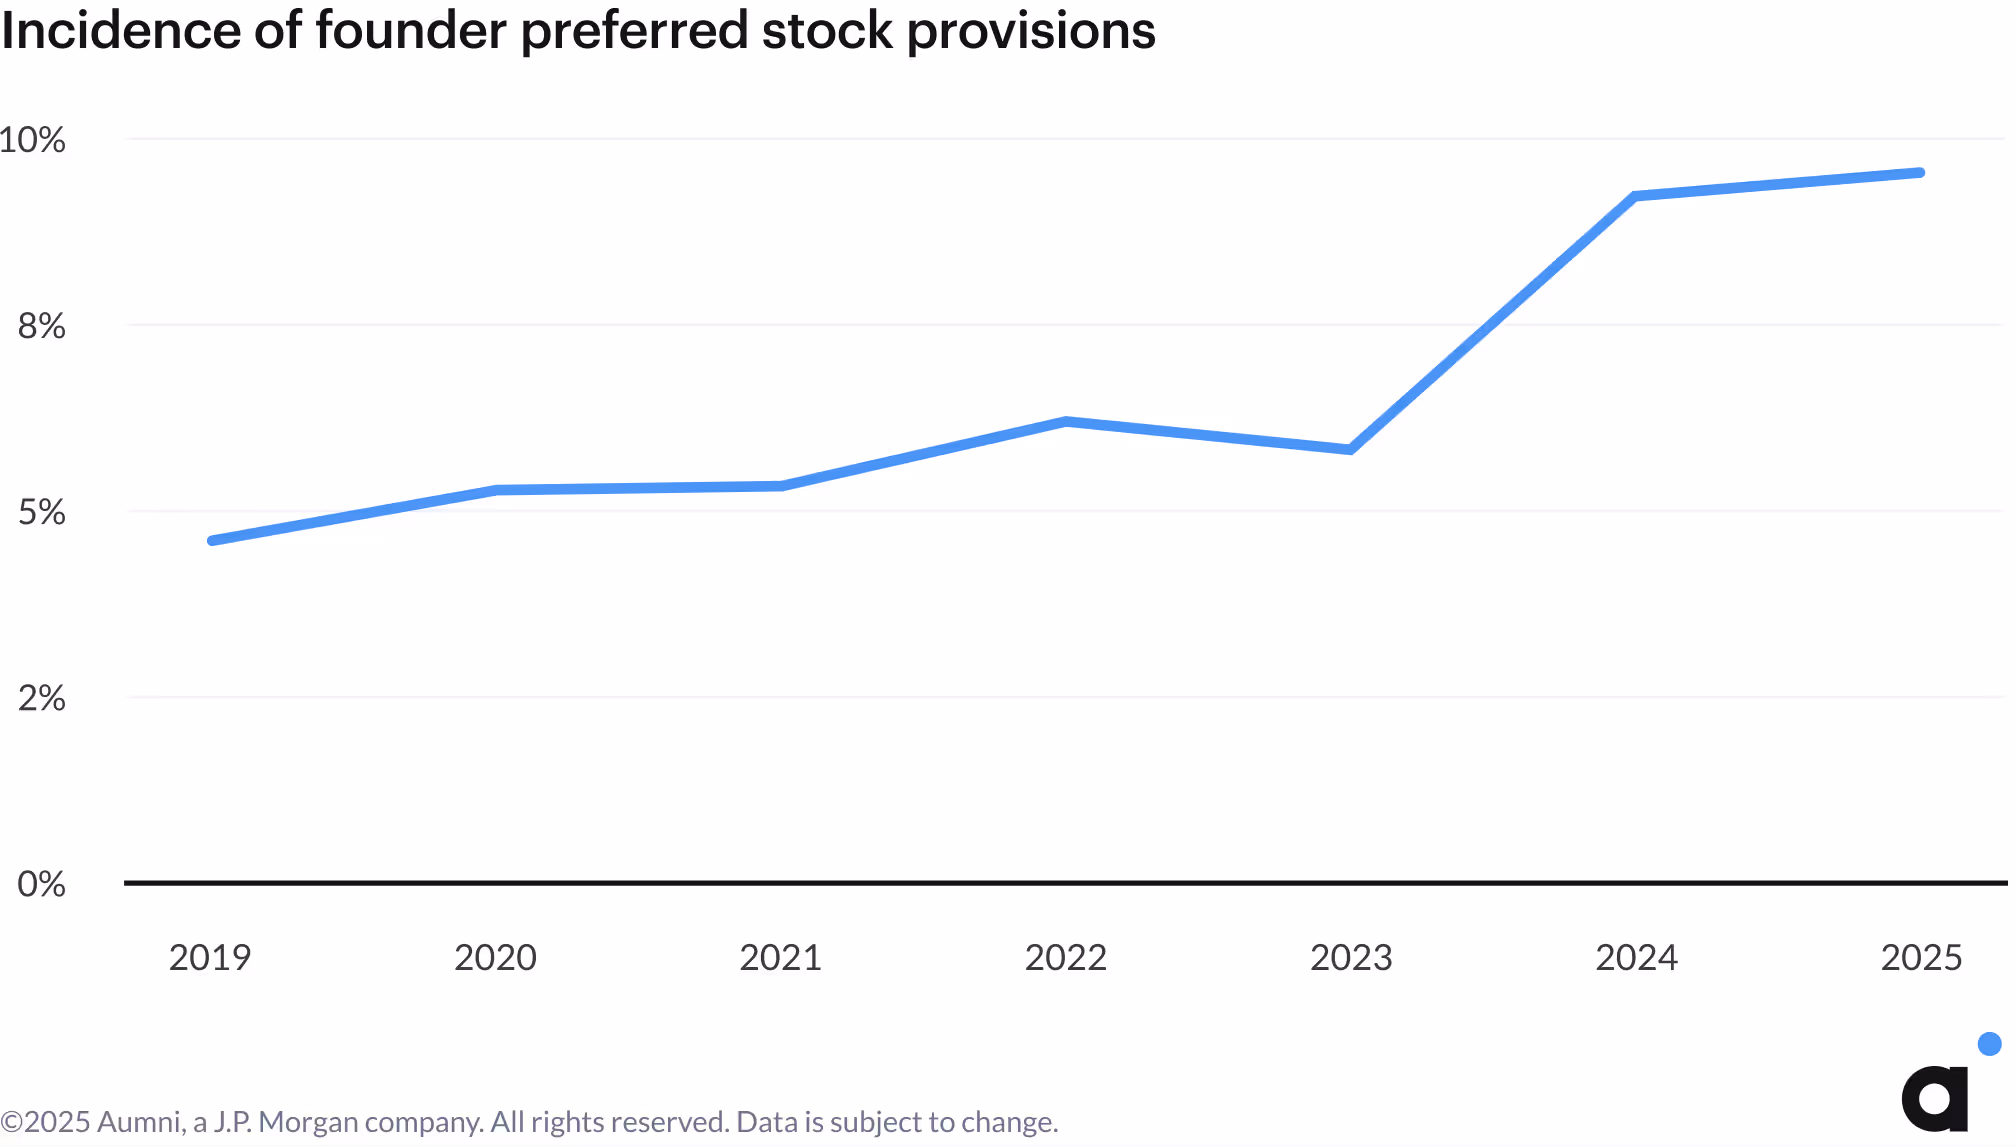
Founder preferred stock, a specialized stock class typically issued to founders upon incorporation and designed to facilitate tax-efficient founder liquidity (often classified as “Series FF Preferred Stock”), has remained at elevated levels through Q3 2025. Founder preferred stock was present in just under 10% of companies at the time of their priced equity financing events in Aumni’s data through Q3 2025, reflecting a modest increase from approximately 6% in 2023.
Liquidation preference multiples greater than 1x have remained rare, representing less than 4% of all deals in 2025.

Convertible Instruments
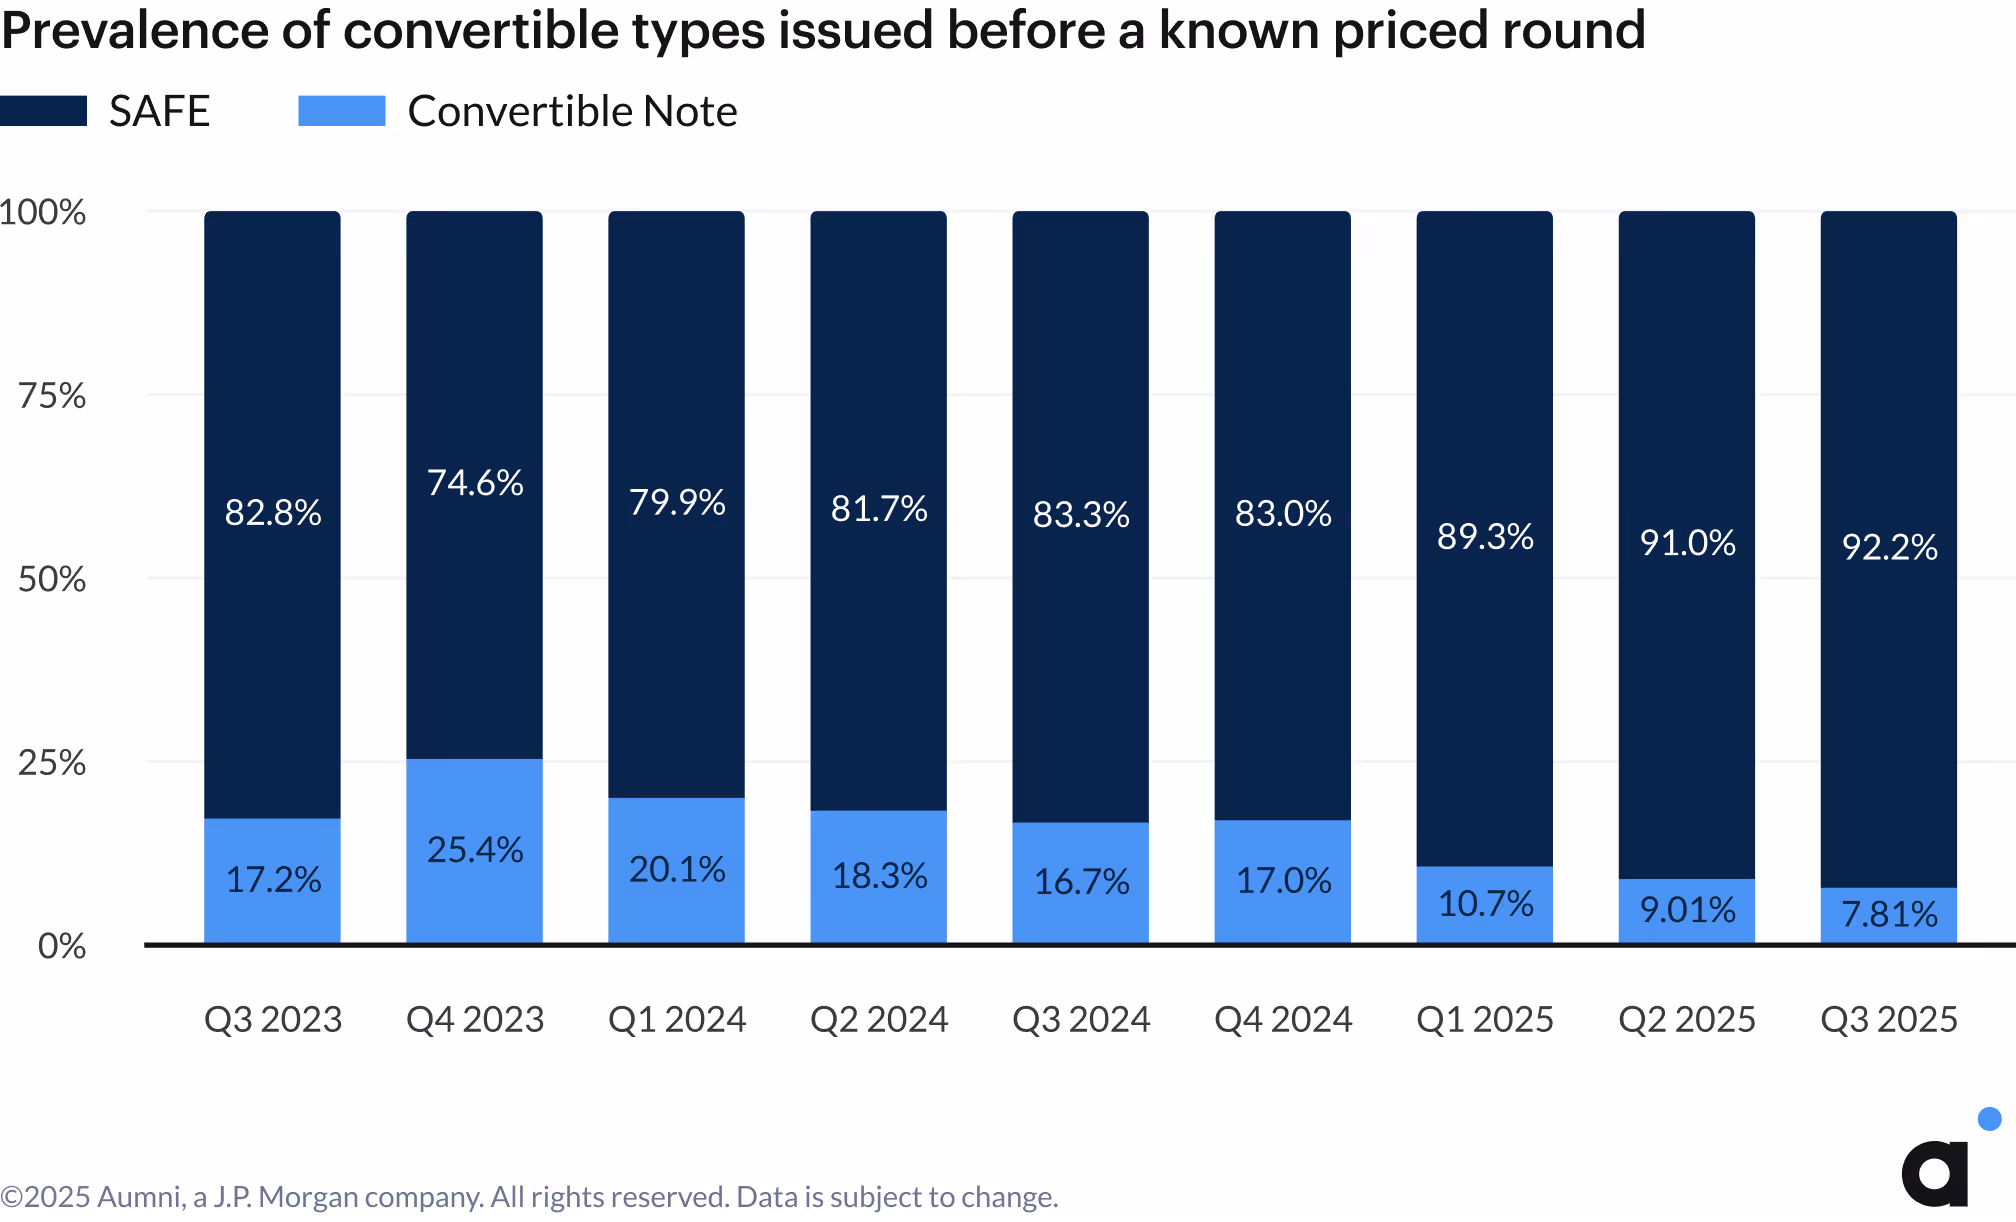
SAFEs continue to dominate pre-seed investments, increasing to 92.2% in Q2 2025. This preference reflects SAFEs' simpler structure that enables faster execution when speed matters in uncertain markets.
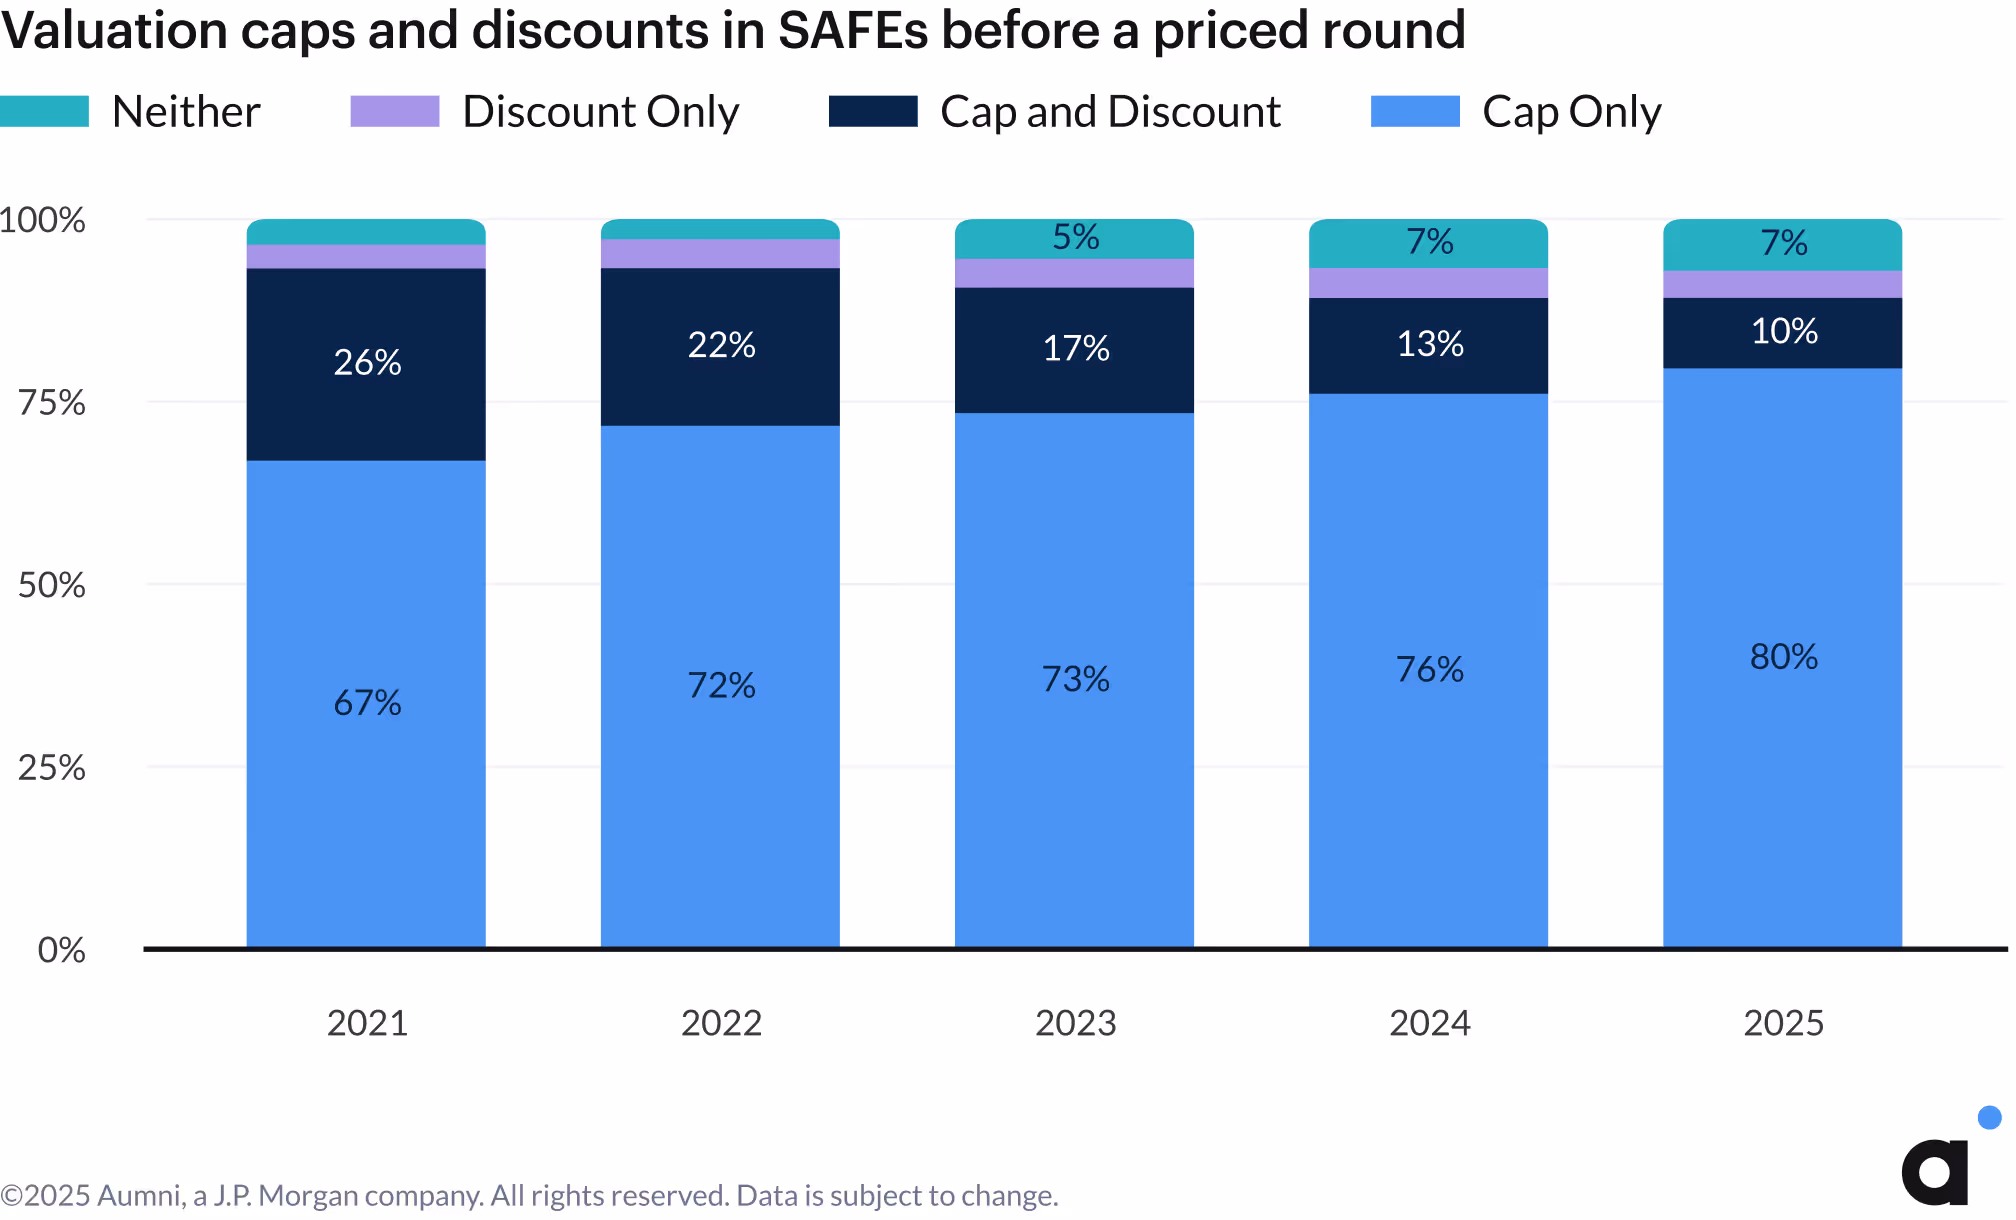
Cap-only SAFEs in particular remain the dominant structure for investments in pre-seed companies, as Cap and Discount SAFEs continue to decline in prevalence, decreasing from 13% in 2024 to 10% in the first half of 2025.
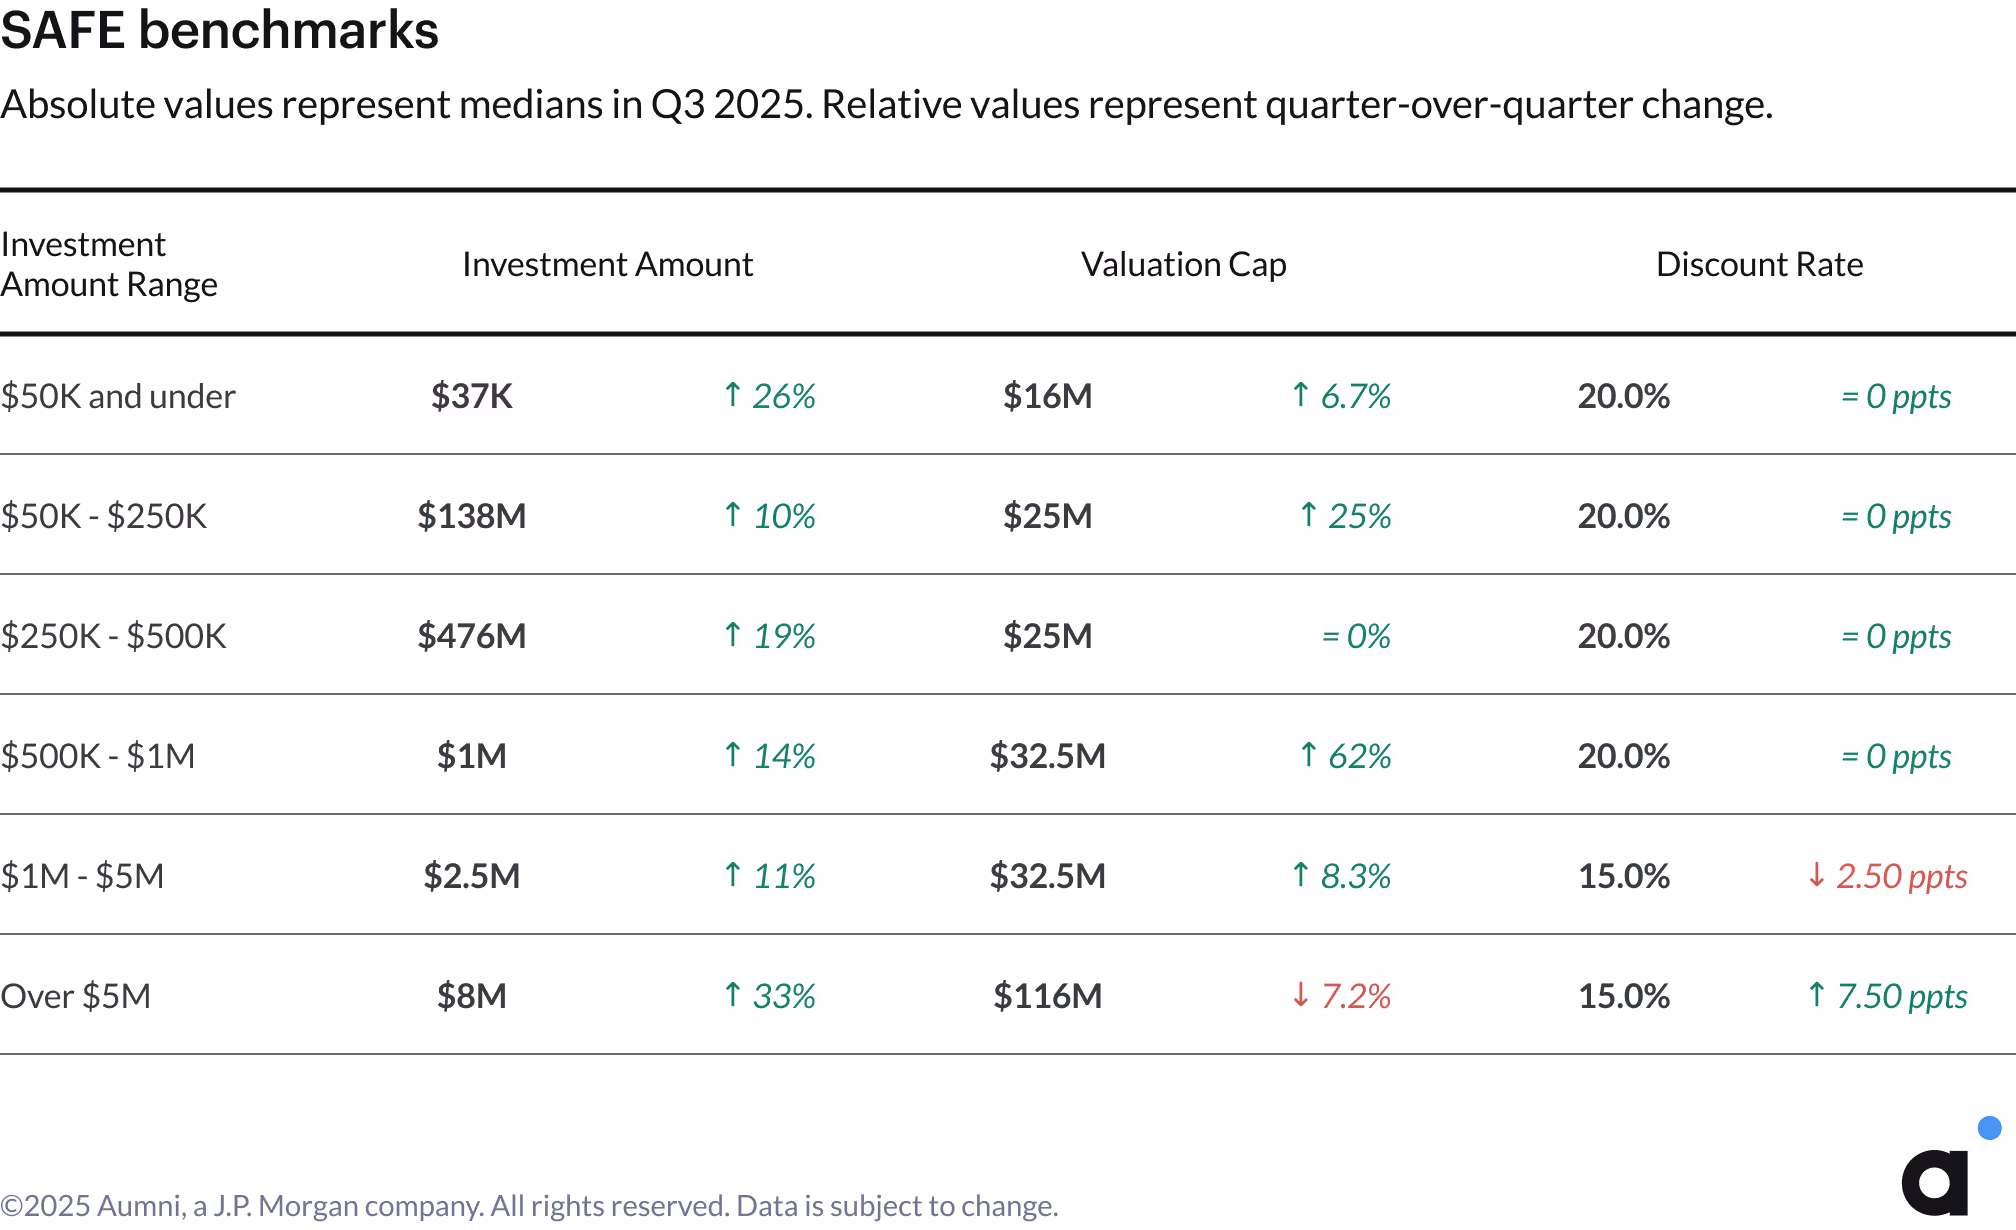
The third quarter highlighted a notable performance split between different early-stage financing instruments, with investment amounts in SAFEs improving across the board while convertible notes experienced notable declines across various investment ranges. Despite decreasing investment amounts, convertible notes saw higher valuation caps in the $50k-to-$250k and $1M-to-$5M investment ranges. Valuation caps for SAFEs increased quarter-over-quarter for most investment ranges, with the exception of SAFEs over $5M, which declined by 7.2%.

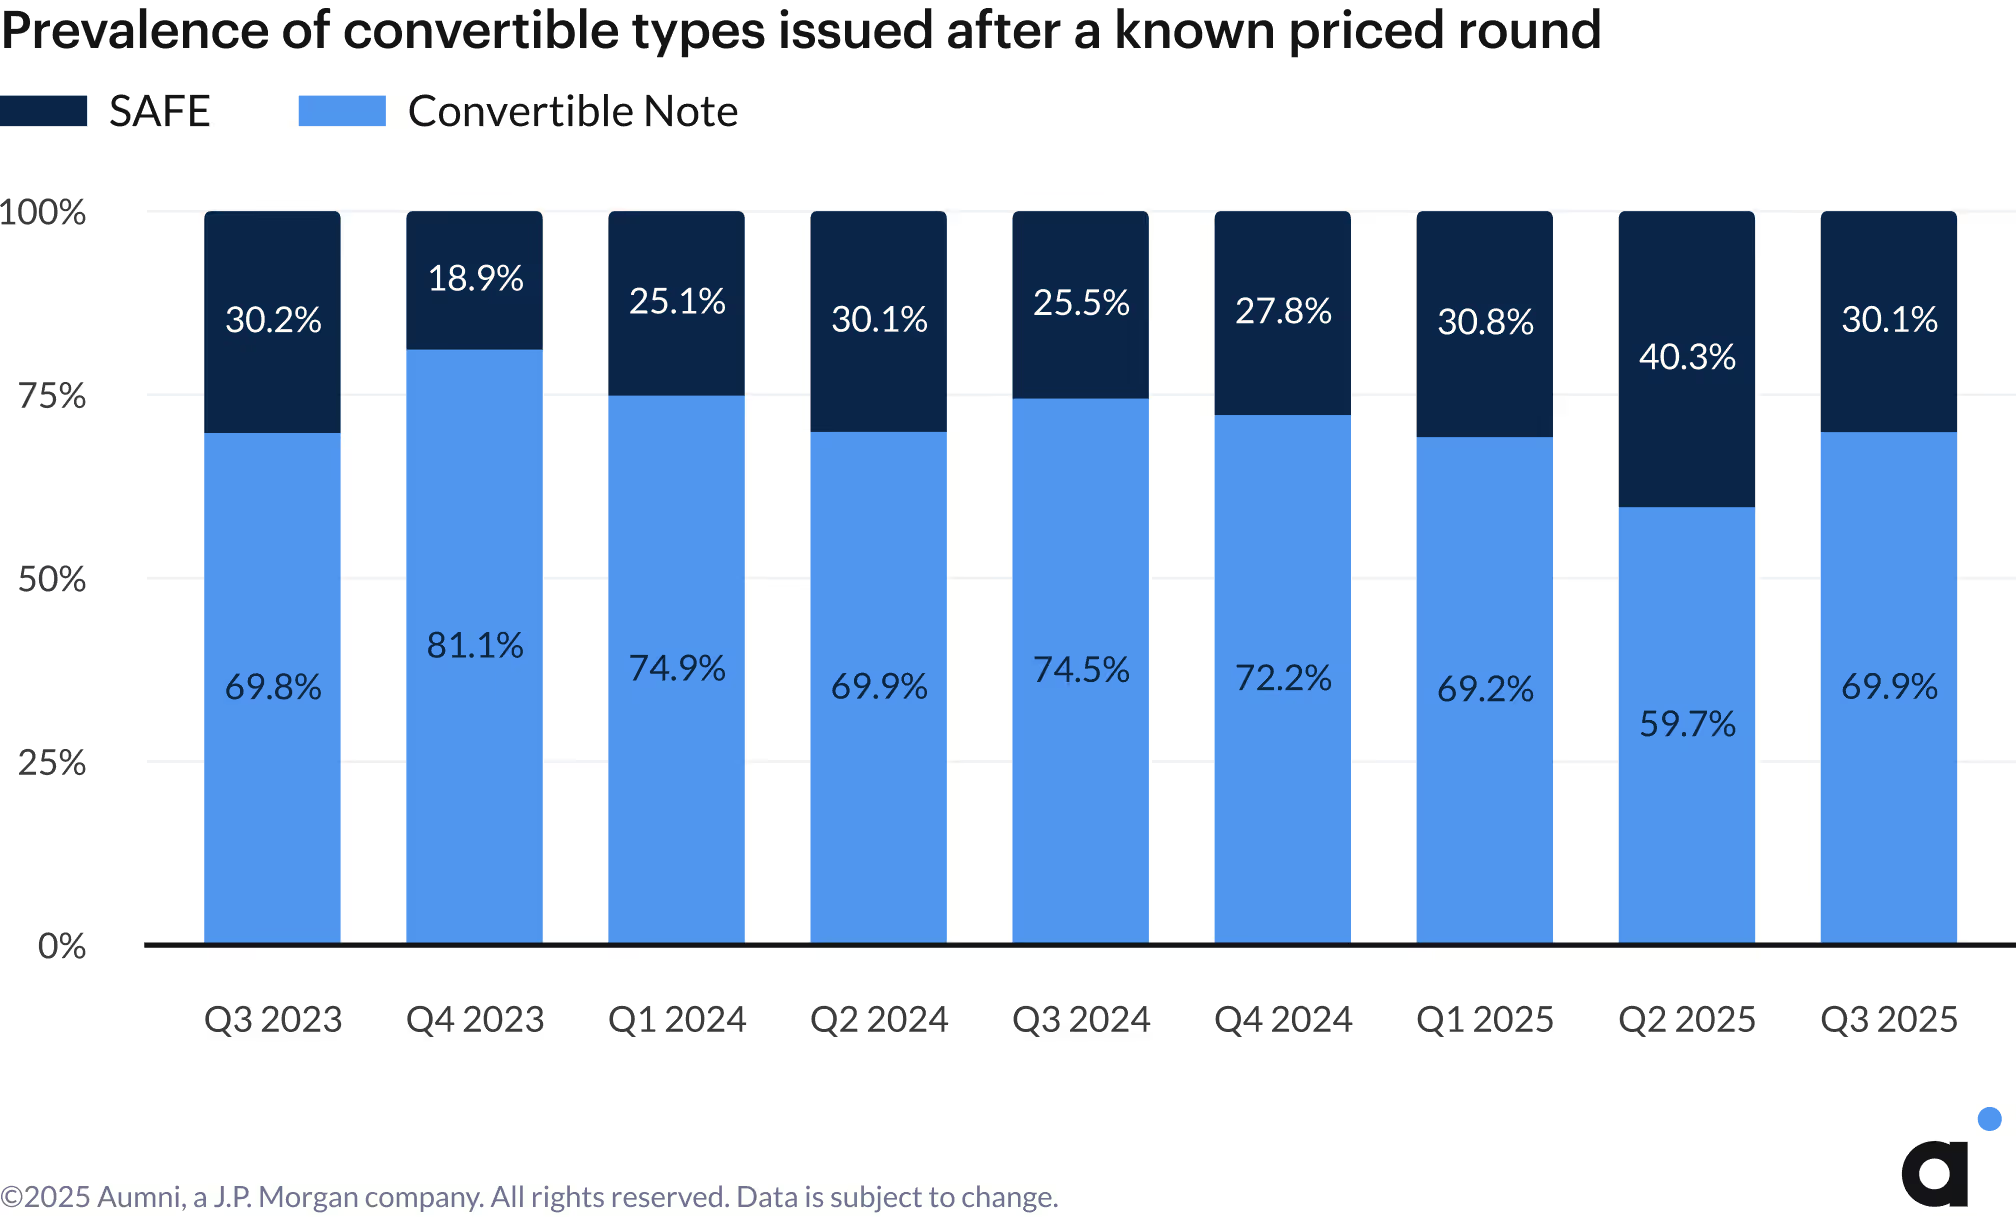
Convertible notes remain more prevalent after priced equity rounds, with their market share returning to three year average levels of approximately 30% in Q3 2025.
Final Remarks
Q3 2025 continued the theme of stage-dependent performance across the venture capital landscape. Early-stage companies saw improved fundraising conditions and faster timelines, while Series C+ rounds faced mounting pressure, with down rounds nearly doubling from 16% to over 28%, reinforcing Series C as a critical filtering point for scaling companies. AI companies maintained their 2.5x revenue multiple premium over non-AI peers (20x vs. 8x) as valuation gaps across most sectors continued widening through 2025. Overall, the venture capital market in Q3 resists simple characterization—early-stage momentum, AI valuation strength, and premium secondary pricing coexisted with mounting late-stage pressure and a notable shift toward preferred stock in secondary markets (up from 33% to 47% of transactions YoY). Ultimately, data through Q3 2025 suggests the venture capital market is segmented, with divergent performance across stage and sector defining the landscape.
Thank you to all colleagues at Aumni and partners at Fenwick for their contributions to this edition of the Venture Beacon.

Venture firms, corporate VCs, fund admins, and law firms all rely on Aumni to manage their venture documents, report on portfolio company KPIs, obtain valuations, benchmark terms, model scenarios, and more.
Aumni is here to help you do venture right. Speak with an expert:
Methodology
Data Sources
Aumni obtains primary data from third parties, including law firms, angel investors, VC firms, CVC firms, institutional investors, and others. All data contained in this report pertains to companies with jurisdiction in the United States and is aggregated from an anonymized database of source data. All data is de-identified prior to analysis by our research team.
Definitions
- Artificial Intelligence Company – A company that develops or employs artificial intelligence technology in their business model and/or product offering.
- Capital Raised – The total sum of new money raised in an equity financing round.
- Commercial Services Sector – Companies operating in the Commercial Services space.
- Consumer Sector – Companies operating in the Consumer Goods or Services space.
- Convertible After a Known Priced Round – Issuance of a convertible note or SAFE after a known equity financing event.
- Convertible Before a Known Priced Round – Issuance of a convertible note or SAFE before a known equity financing event.
- Convertible Note – A short–term debt instrument that converts into equity.
- Convertible Note Interest Rate – The interest rate at which a convertible note’s principal will accrue interest over time.
- Convertible Note/SAFE Purchase Amount – The dollar value of an investment in a Convertible Note or SAFE.
- Corporate Jurisdiction – The state of incorporation for a legal entity. The location where the entity formed and registered its articles of incorporation.
- Dilution – The percentage decrease in ownership of a company due to the issuance of new shares.
- Discount – The discount a Convertible Note or SAFE holder receives on the share price relative to subsequent investors during the conversion of the security in an equity financing round.
- Down Round - A financing event in which a company obtains a new pre-money valuation equal to or less than 95% of the post-money valuation of the previous financing round.
- Early Stage – Early stage comprises Series Seed, Series A, and Series B transactions.
- Energy and Resources Sector – Companies operating in the Energy, Environment, or Natural Resources space.
- Entertainment Sector – Companies operating in the Media, Entertainment, or Recreation space.
- Financials Sector – Companies operating in the Finance, Real Estate, or Insurance space.
- Flat Round - A financing event in which a company obtains a new pre-money valuation between 95% and 105% (exclusive) of the post-money valuation of the previous financing round.
- Founder Preferred Stock – A specialized stock class often designed to facilitate tax-efficient founder liquidity (often classified as “Series FF Preferred Stock”).
- Healthcare Sector – Companies operating in the Healthcare or Life Sciences space.
- Industrials Sector – Companies operating in the Aerospace, Manufacturing, or Industrials space.
- Investment Amount Range – Categories that group convertible notes and SAFEs according to the amount of capital invested in a given company by a distinct investor.
- Late Stage – Late Stage comprises Series C and later transactions.
- Lead Investor – The legal entity identified as the lead investor in an equity financing or the one that purchased the largest number of shares.
- Mega Deal – An equity financing round where the total capital raised is greater than or equal to $100M USD.
- Post-Money Valuation – The enterprise value of a portfolio company following the closing of an Equity Financing, calculated as the fully diluted share count of a company multiplied by the highest new money original issue price of any equity class issued in an equity financing.
- Pre-Money Valuation – The determined value of a company, usually via a 409A valuation, prior to the closing of an equity financing round.
- Priced Equity Round – A financing event where a company raises capital from institutional investors at a set price per share based on the fair market value determined through an independent 409a valuation.
- Primary Round – The first priced equity round of a specific class in the traditional venture capital sequence (Series Seed, Series A, Series B, etc.).
- Qualified Financing – A financing event that meets pre-determined criteria and triggers the conversion of convertible securities into equity ownership of the company.
- Revenue multiple – A valuation metric that compares a company's pre-money valuation to its revenue.
- Secondary Premium, Par, Discount – Categories for secondary transactions that indicate whether the price per share paid in the transaction was at a value above (premium), the same as (par), or below (discount) the share price associated with the most recent priced equity round. The calculation evaluates secondary transactions that occur greater than 90 days after the date of an equity financing event as stated in the closing documents, up to four days before the date of the next capital raise.
- Secondary Tranche – An aggregation of multiple distinct transactions, where a single buyer purchases shares in a company from one or more parties, often a mix of founders, employees, and other investors. A secondary tranche represents a high-level view of a single purchaser’s intent to own shares in a given company.
- Series C+ – All priced equity rounds named Series C or later are grouped into Series C+.
- Series D+ – All priced equity rounds named Series D or later are grouped into Series D+.
- Simple Agreement for Future Equity (SAFE) – A convertible security that allows investors to buy shares in a future-priced equity round.
- Technology Sector – Companies operating in the Information Technology space.
- Up Round – A financing event in which a company obtains a new pre-money valuation equal to or greater than 105% of the post-money valuation of the previous financing round.
- Valuation Cap – A price ceiling at which a SAFE or Convertible Note will convert to stock ownership in the event of a Qualified Financing.
- Valuation Markup – The percentage change in valuation from one stage of financing to the next, e.g., the change in valuation from Seed to Series A.
- Vintage Year – The year a company is founded.
Methods and Calculations
- Indexed Values to Base Period – The relative change in a value, where the initial value in a base period is set to 100, and all subsequent changes reference this initial value.
- Revenue Multiples – Derived by dividing a company's pre-money valuation by the simple annualization of quarterly revenue data (multiplying reported quarterly revenue by four) from within the same quarter as the closing date of an executed equity financing event.
- Series Stages – Series A through D+ stage names are based on the legal name of the round and are inclusive of shadow rounds, e.g., Series A is inclusive of Series A-1.
- Stage-to-Stage Two Year Graduation Rate Cohorts – The proportion of companies that raise additional financing of the next class in the traditional venture capital sequence (Series Seed, Series A, Series B, etc.) within two years of a primary priced equity round.
- Time between Rounds – The length of time, measured in months, between two sequential equity financing events for a given company. The final output is a median or a mean across all companies per quarter.