Venture Beacon

Executive Summary
- Data through the first half of 2025 reinforces early-stage resilience amid late-stage decline. Seed through Series C rounds demonstrated strong performance in Q2 2025, with deal sizes growing 5 to 22% and valuations rising 3 to 60% quarter-over-quarter, while Series D+ rounds experienced sharp declines of 8.9% in capital raised and 48% in pre-money valuations, reflecting reduced mega-round activity at later stages.
- Seed rounds are evolving structurally, likely to bridge extended fundraising timelines. Seed deals continued to outperform later-stage financings in H1 2025, with companies raising larger Seed rounds. The data suggests traditional stage definitions are evolving as Seed rounds increasingly adopt characteristics historically associated with Series A financings. Further, the Seed to Series A graduation pipeline improved significantly, with 21% of Q2 2023 Seed raises in Aumni data successfully going on to raise a Series A within the following two years, from 12% the prior quarter.
- AI premiums persist despite shifting market share. Artificial Intelligence companies maintained strong valuation premiums across multiple sectors at Series A, though AI representation across funding stages has plateaued or declined in H1 2025. AI companies in the aggregate have taken a lower share of total funding allocation in the first half of 2025 compared to 2024, with the exception of Series D+ rounds.
- Secondary markets stabilized with improving sentiment. While secondary transaction volume remains at pre-pandemic levels, 28.9% of H1 2025 secondaries traded at premiums to recent equity rounds. The average secondary tranche size remains subdued at $1.2M to $1.4M, indicating that while sentiment has improved, it remains tempered by continued investor caution.
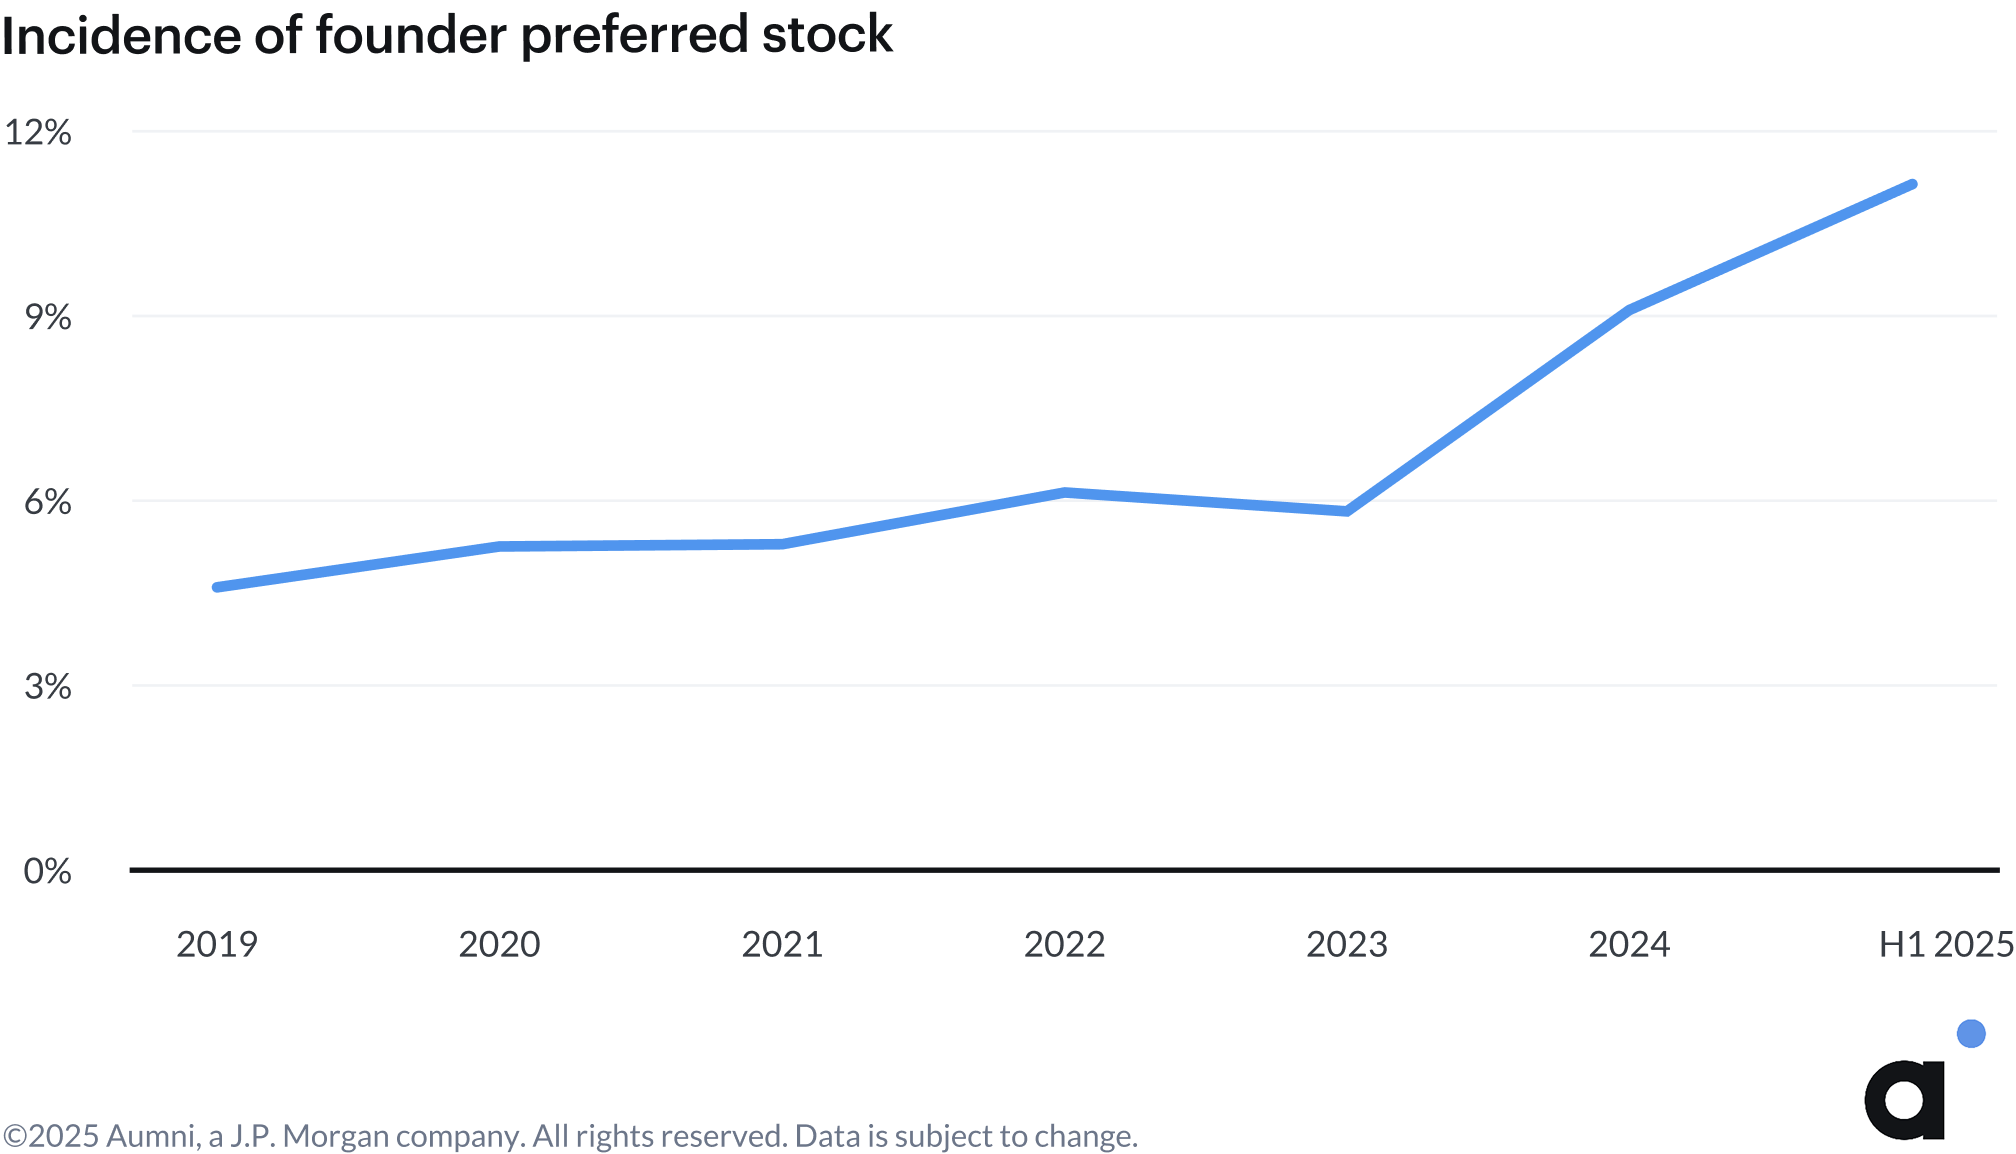
- Founder-friendly terms continue to accelerate in H1 2025. Founder preferred stock incidence accelerated to 11% in H1 2025, measured by inclusion as a stock provision tracked in equity financing closing set documents, from 9% in 2024 and 6% in 2023.

.avif)
.avif)
.avif)
Foreword

The venture market in Q2 2025 continued to show signs of positive momentum for startups and investors, with deal sizes and pre-money valuations increasing in Series Seed through Series C financing rounds and down rounds declining slightly across all funding stages in the first half of 2025. However, we also saw that this positive momentum did not necessarily translate across all stages of financing or industries, as deal sizes and pre-money valuations for Series D+ rounds declined and fundraising timelines extended. These data points, together with a reduction in the number of mega late-stage deals in Q2 2025, may indicate that investors continue to be selective in deploying capital based on more detailed KPIs and business models, in particular with AI-focused companies. At Fenwick, we’re seeing this evolution play out daily in our work with early-stage startups, growth-stage companies, and investors across the innovation economy.
One of the more striking signals in this report is the increased prevalence of founder preferred stock, which was featured in nearly 11% of companies that had priced equity deals in the first half of 2025. That’s nearly double its share from just two years ago. Founder preferred stock provisions have traditionally been implemented for tax efficiencies and signal a desire for pre-exit liquidity. This trend shows that founders are taking a more proactive approach to long-term planning and liquidity early in a company’s life cycle. This also may reflect an acknowledgement between founders and investors that traditional liquidity exits – an IPO or M&A – may take longer to achieve.
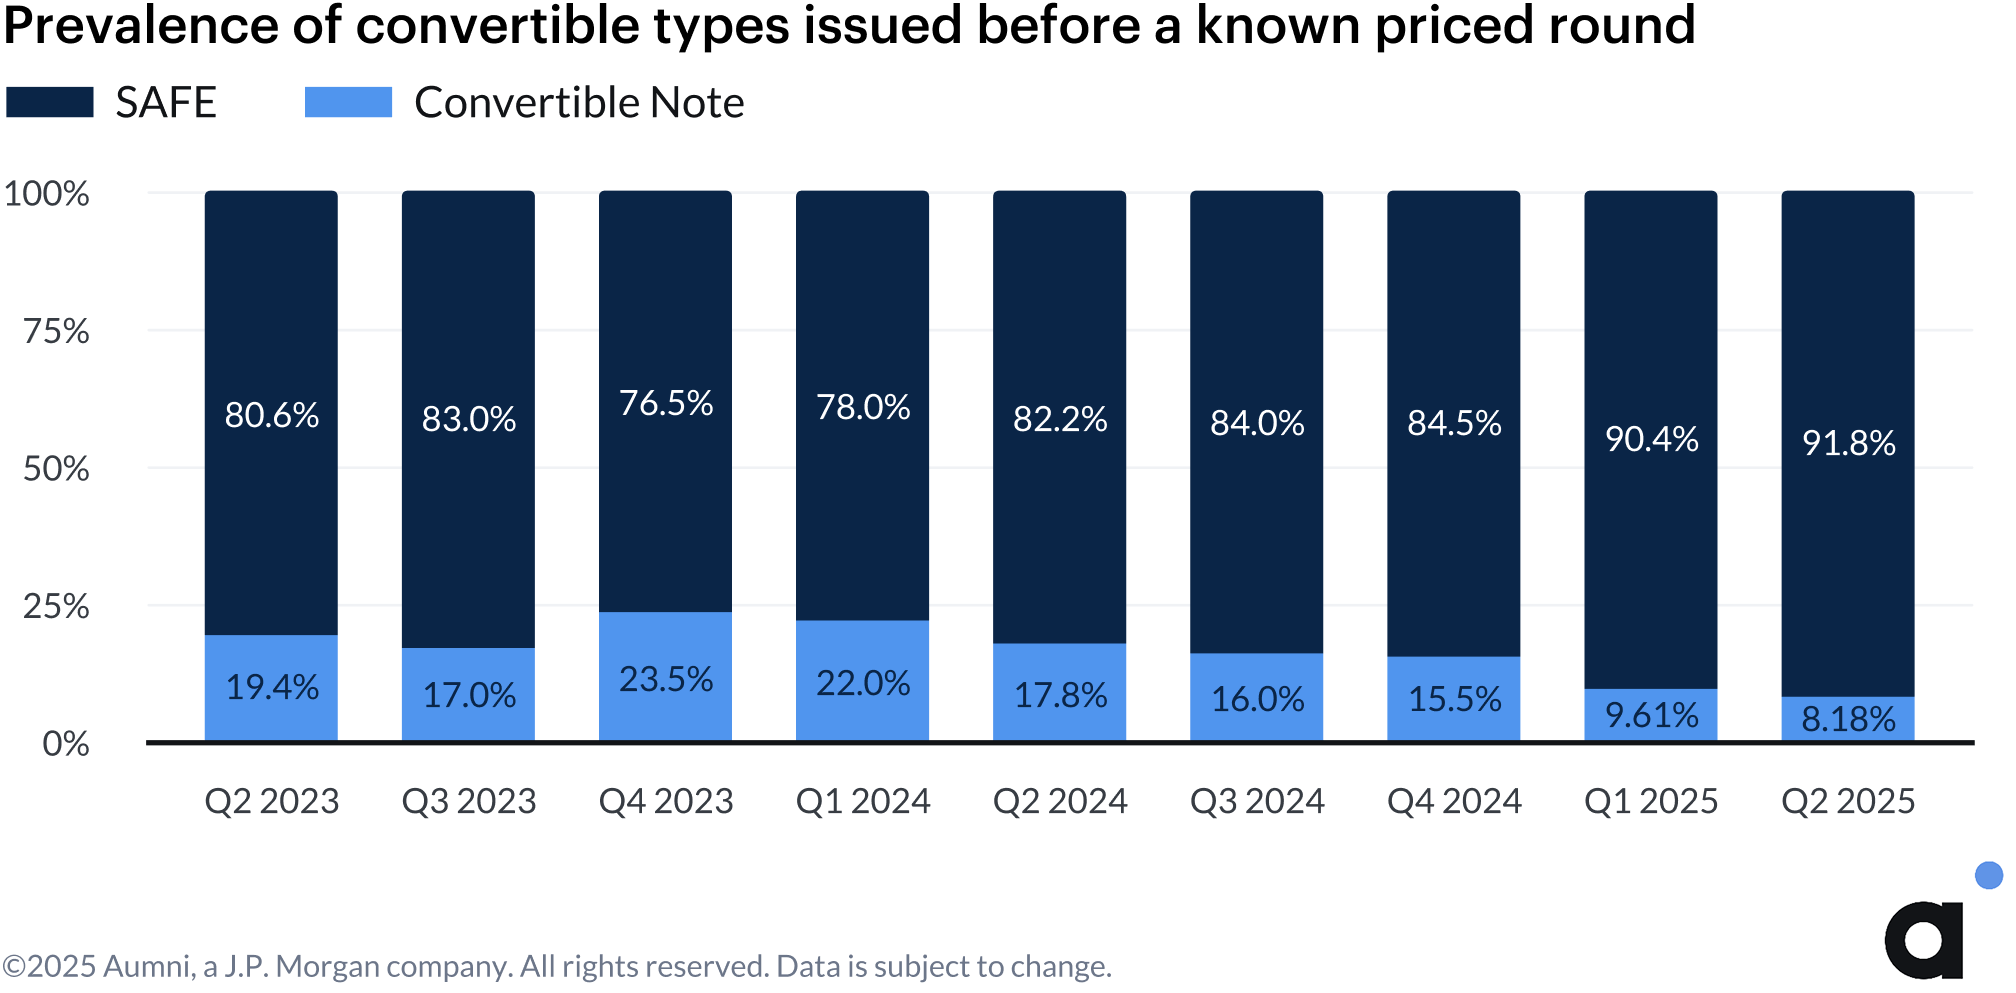
Another area that continues to evolve is the use of convertible instruments, particularly SAFEs. SAFEs now account for more than 90% of pre-seed investments (an all-time high) and while they remain a flexible tool, we’re seeing increased movement of valuation caps, especially at the very low and very high ends of the spectrum. For example, with respect to large SAFEs over $5 million, median valuation caps declined by more than 30% in Q2 2025. Convertible notes are seeing similar downward pressure, with valuation caps declining across most deal sizes. These changes may reflect a shift in bargaining power as investors look to improve their potential return.
Secondaries have also begun to rebound in a meaningful way. While transaction volumes remain modest, the share of secondary deals trading at a premium to the last preferred round price is up meaningfully, now surpassing 28%. Liquidity transactions continue to be important for (i) founders and employees, in particular to diversify their holdings or pay for large expenses such as house down payments, (ii) investors, who are increasingly willing to pay for access to high-growth, quality companies in the hopes of generating large returns, and (iii) companies seeking to add quality investors to the cap table without additional dilution. We expect secondaries to continue to be top of mind for the venture community, particularly as exit timelines extend, talent looks to access liquidity, and companies experience growing valuations and increasing investor demand.
Together, these developments suggest a market that is neither frozen nor frothy. Instead, we believe the market is cautious, increasingly rational, and favoring companies that show strong fundamentals. As always, we’re grateful to partner with Aumni and J.P. Morgan in producing this data-rich, actionable report. We hope the insights from this quarter help you navigate what’s next.
Warm regards,
.png)
.png)
.png)
.png)
.png)

The Venture Beacon
After a challenging start to the fundraising environment early in the year, deal sizes and pre-money valuations improved in the second quarter of 2025 for Seed through Series C equity financings, with quarter-over-quarter increases ranging from 5.5 to 22% for deal sizes and 2.9 to 60% for valuations. Meanwhile, Series D+ rounds declined sharply, with capital raised falling 8.9% and pre-money valuations dropping 48%, which stands in sharp contrast to the 30% increase in Q1 2025. This decline was driven by a reduction in the number of large late-stage rounds in Q2 in Aumni’s data. The divergent performance between early- and late-stage rounds continues a pattern that has defined the venture market since 2022.
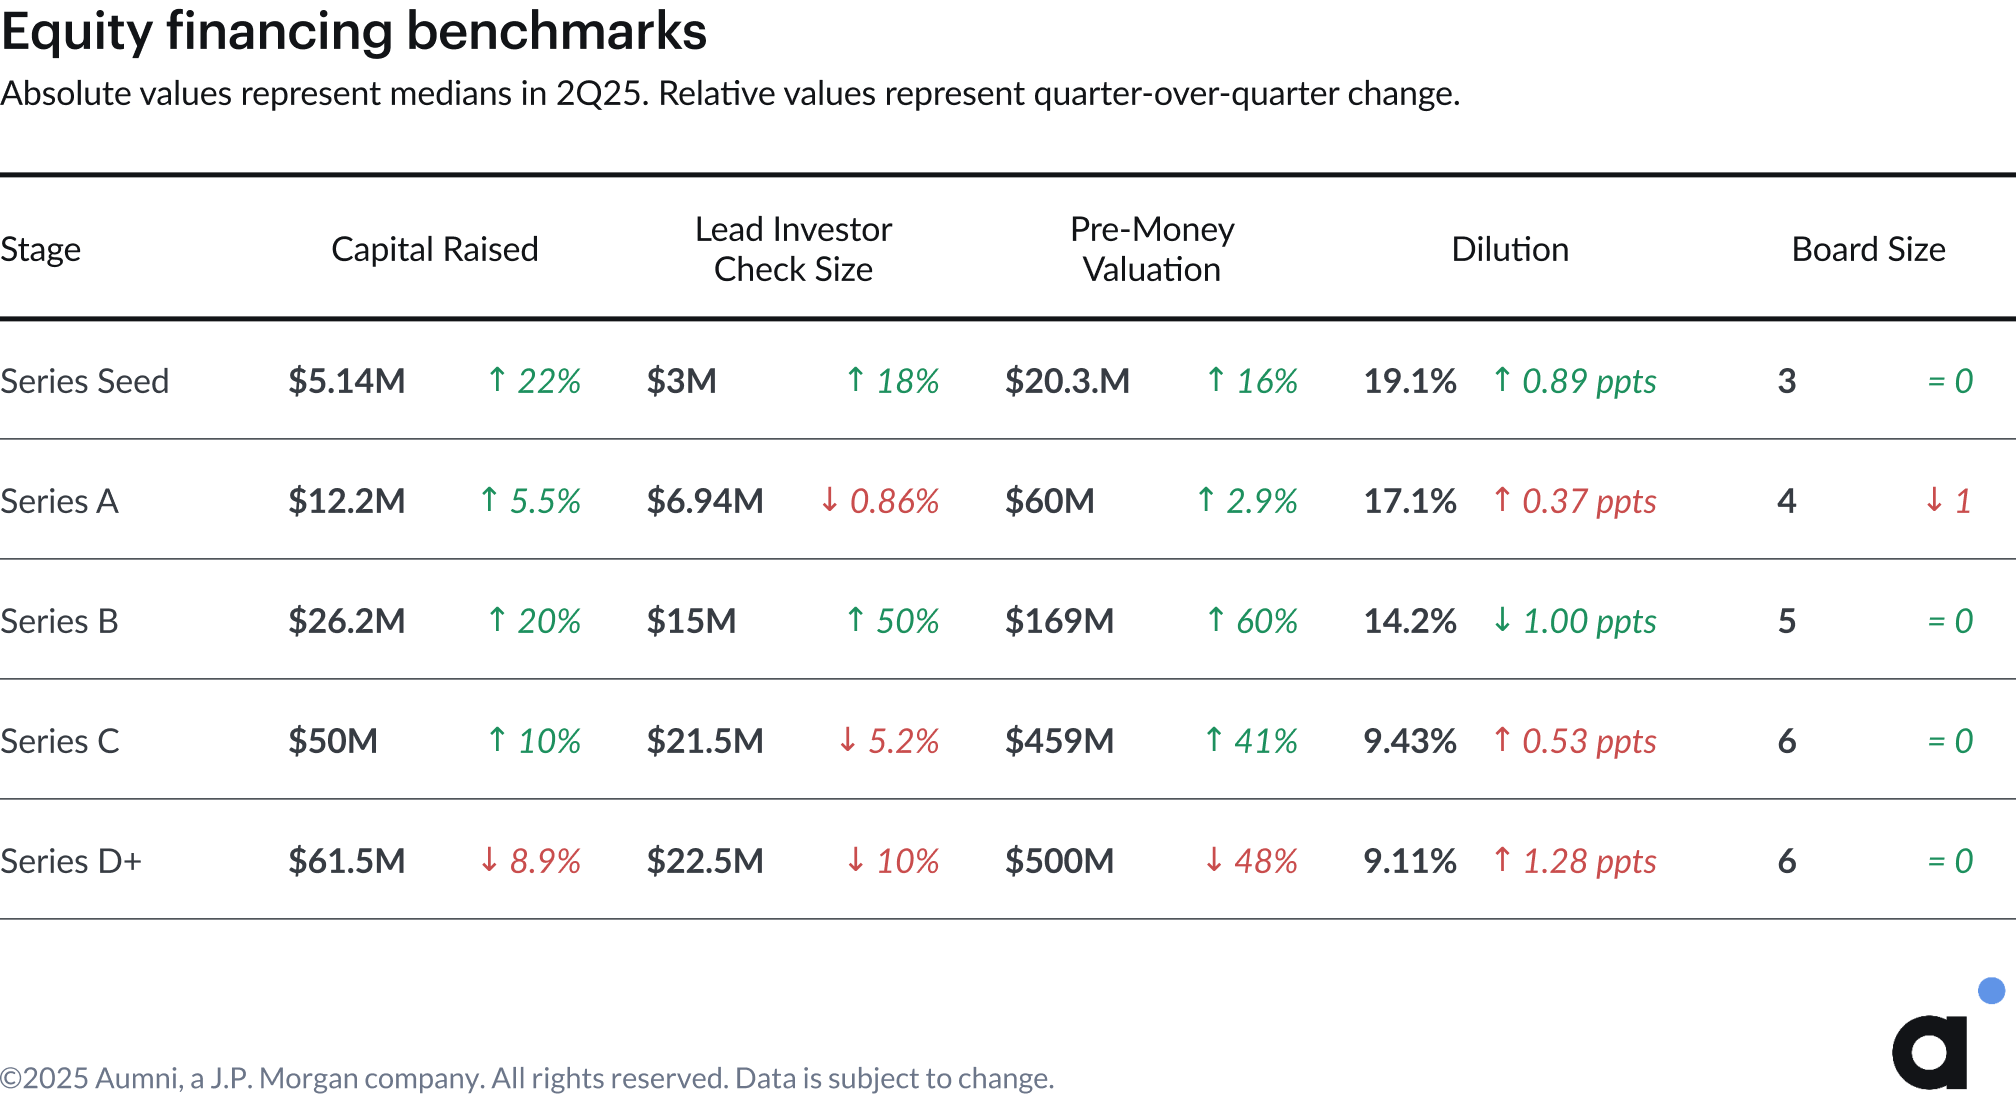
The recalibration of board sizes that began in Q1 continued through Q2, with the median board size at Series A shrinking to four, from five historically. Meanwhile, lead investor check sizes and stage-to-stage dilution both showed mixed results in Q2, with no clear trends other than check sizes for Series C+ rounds continuing the downward trend since Q1.
Overall, Seed stage deals continued to outperform in the first half of the year relative to late-stage financings. Combined with notably strong performance at Series A relative to 2021 levels, this early-stage strength likely reflects the resilience of early-stage investing and the market's continued preference for newer startups, including those leveraging AI to do more with less, compared to potentially over-valued late-stage companies. As fundraising timelines continue to extend across all stages, companies may also be mitigating risk by raising larger Seed rounds to bridge an increasingly long gap to Series A. This structural shift suggests that traditional stage definitions may be evolving yet again, with Seed rounds taking on characteristics historically associated with Series A financings.
%201.png)
%201.png)
Sector Benchmarks
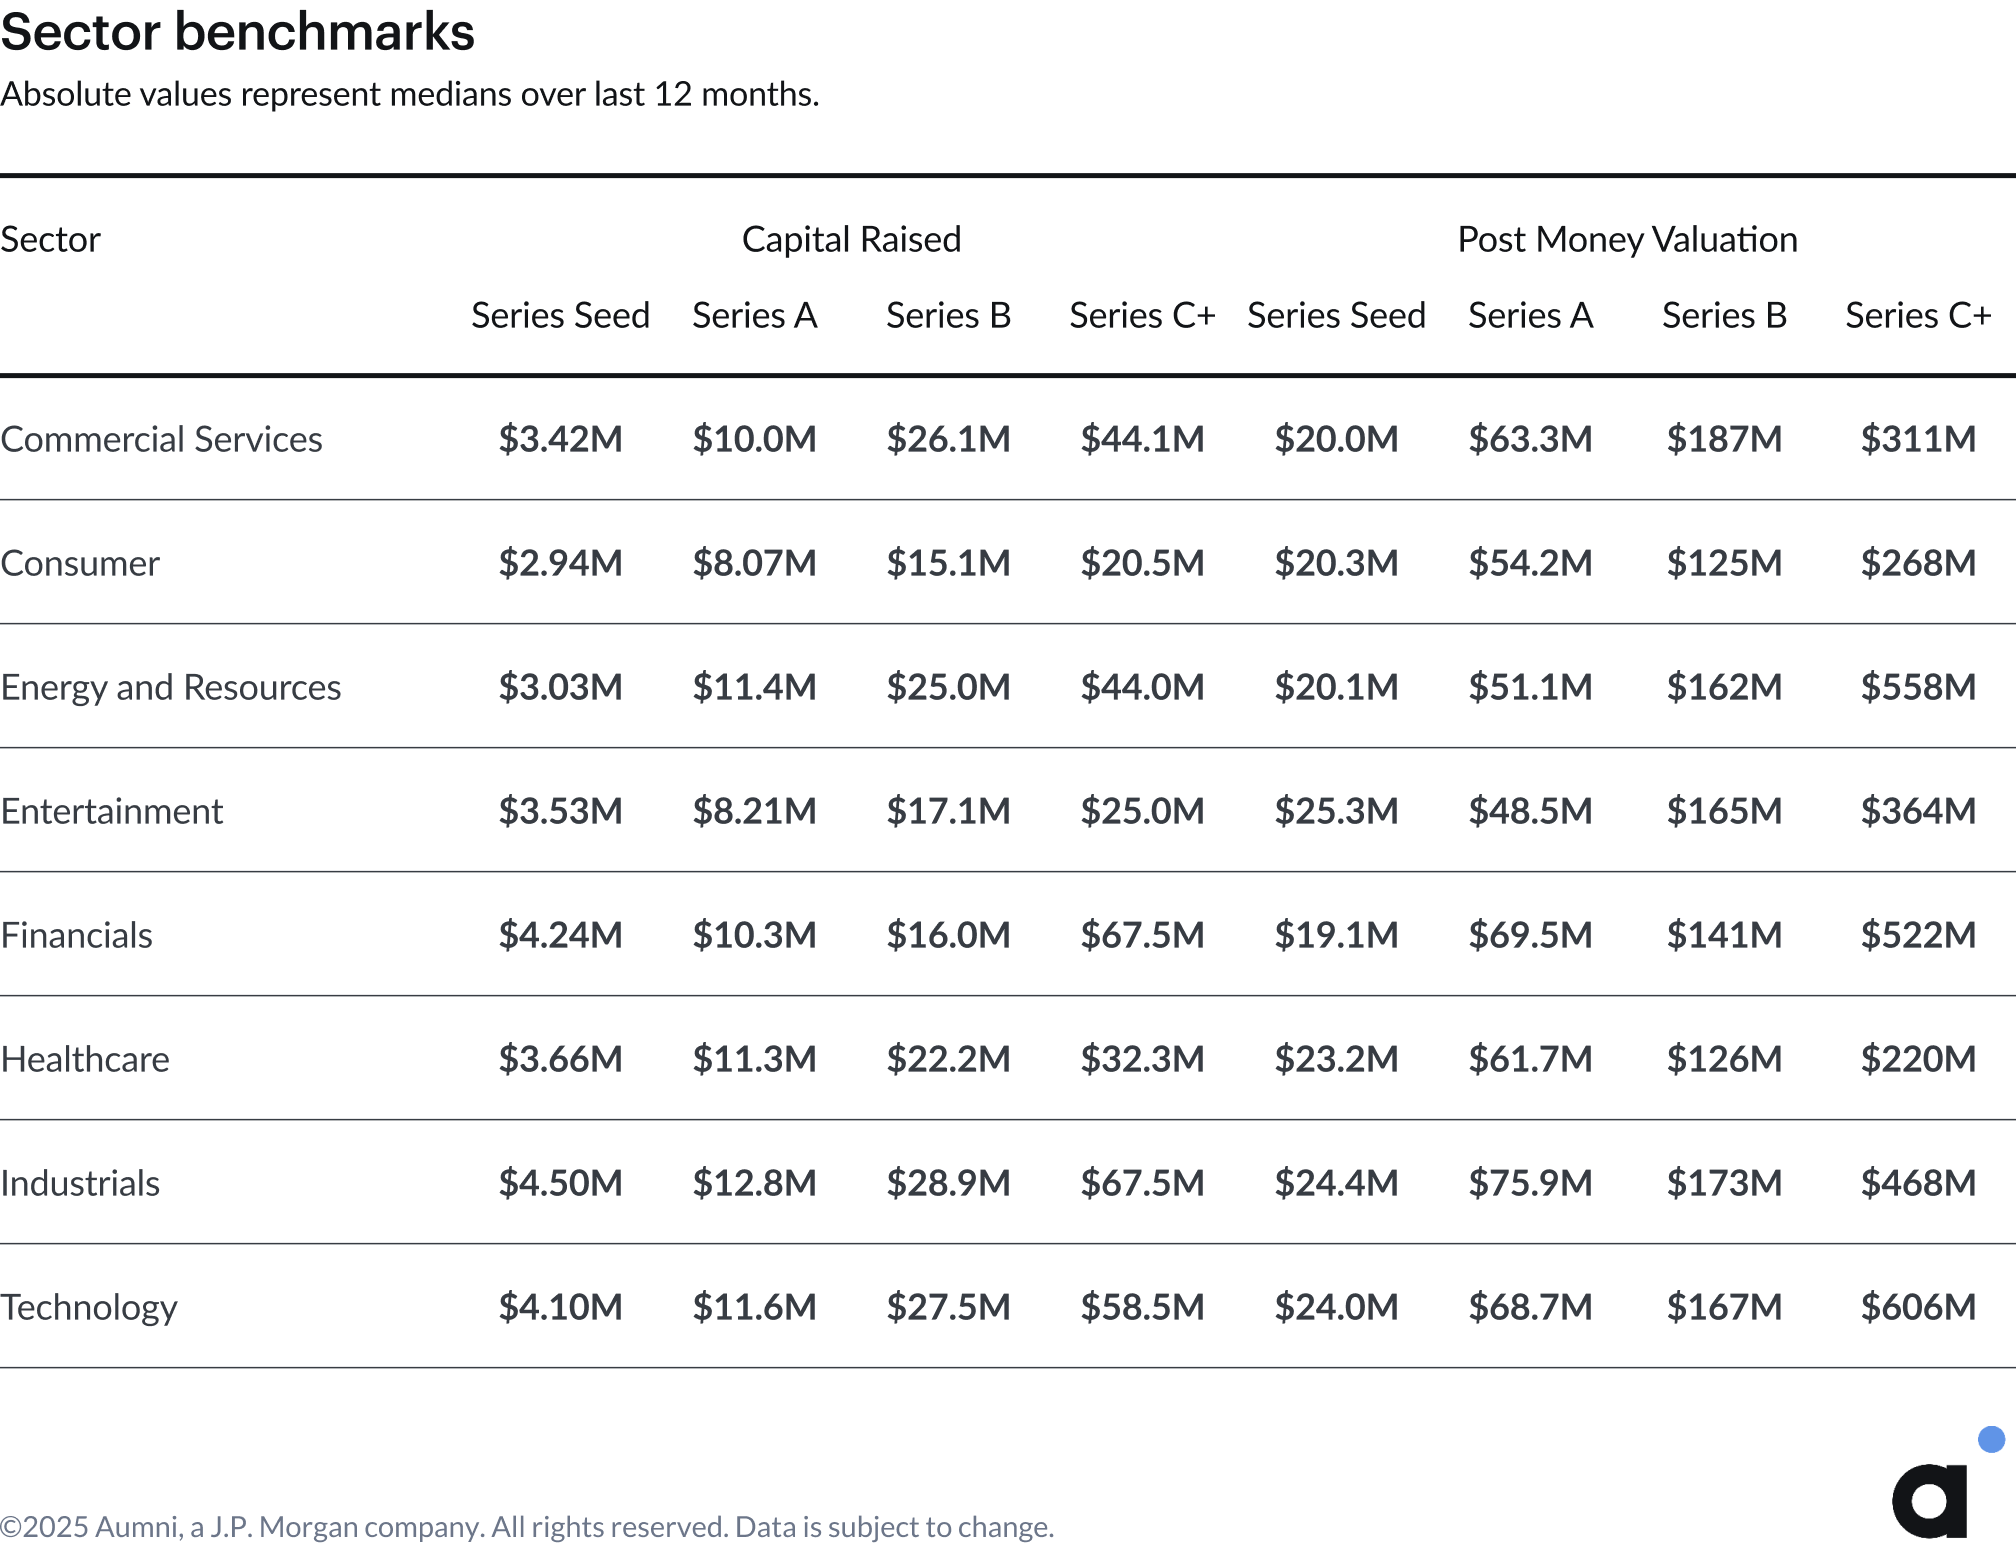
While the fundraising environment generally improved in Q2, certain sectors outpaced their peers. Series A deals in Industrials, Commercial Services, Financials, and Technology all posted year-over-year gains in both deal sizes and valuations.
Very broadly speaking, we would expect capital intensive sectors, such as Industrials, to raise relatively more capital at each stage of financing. Most sectors show sensible and stable funding patterns across stages, however differences between sectors and stages can be stark. For example, the median Series B capital raised in Commercial Services is nearly double that of Consumer. At later stages, this divergence becomes even more pronounced, with Healthcare and Consumer startups consistently raising less capital and obtaining lower valuations in Series C+ rounds.
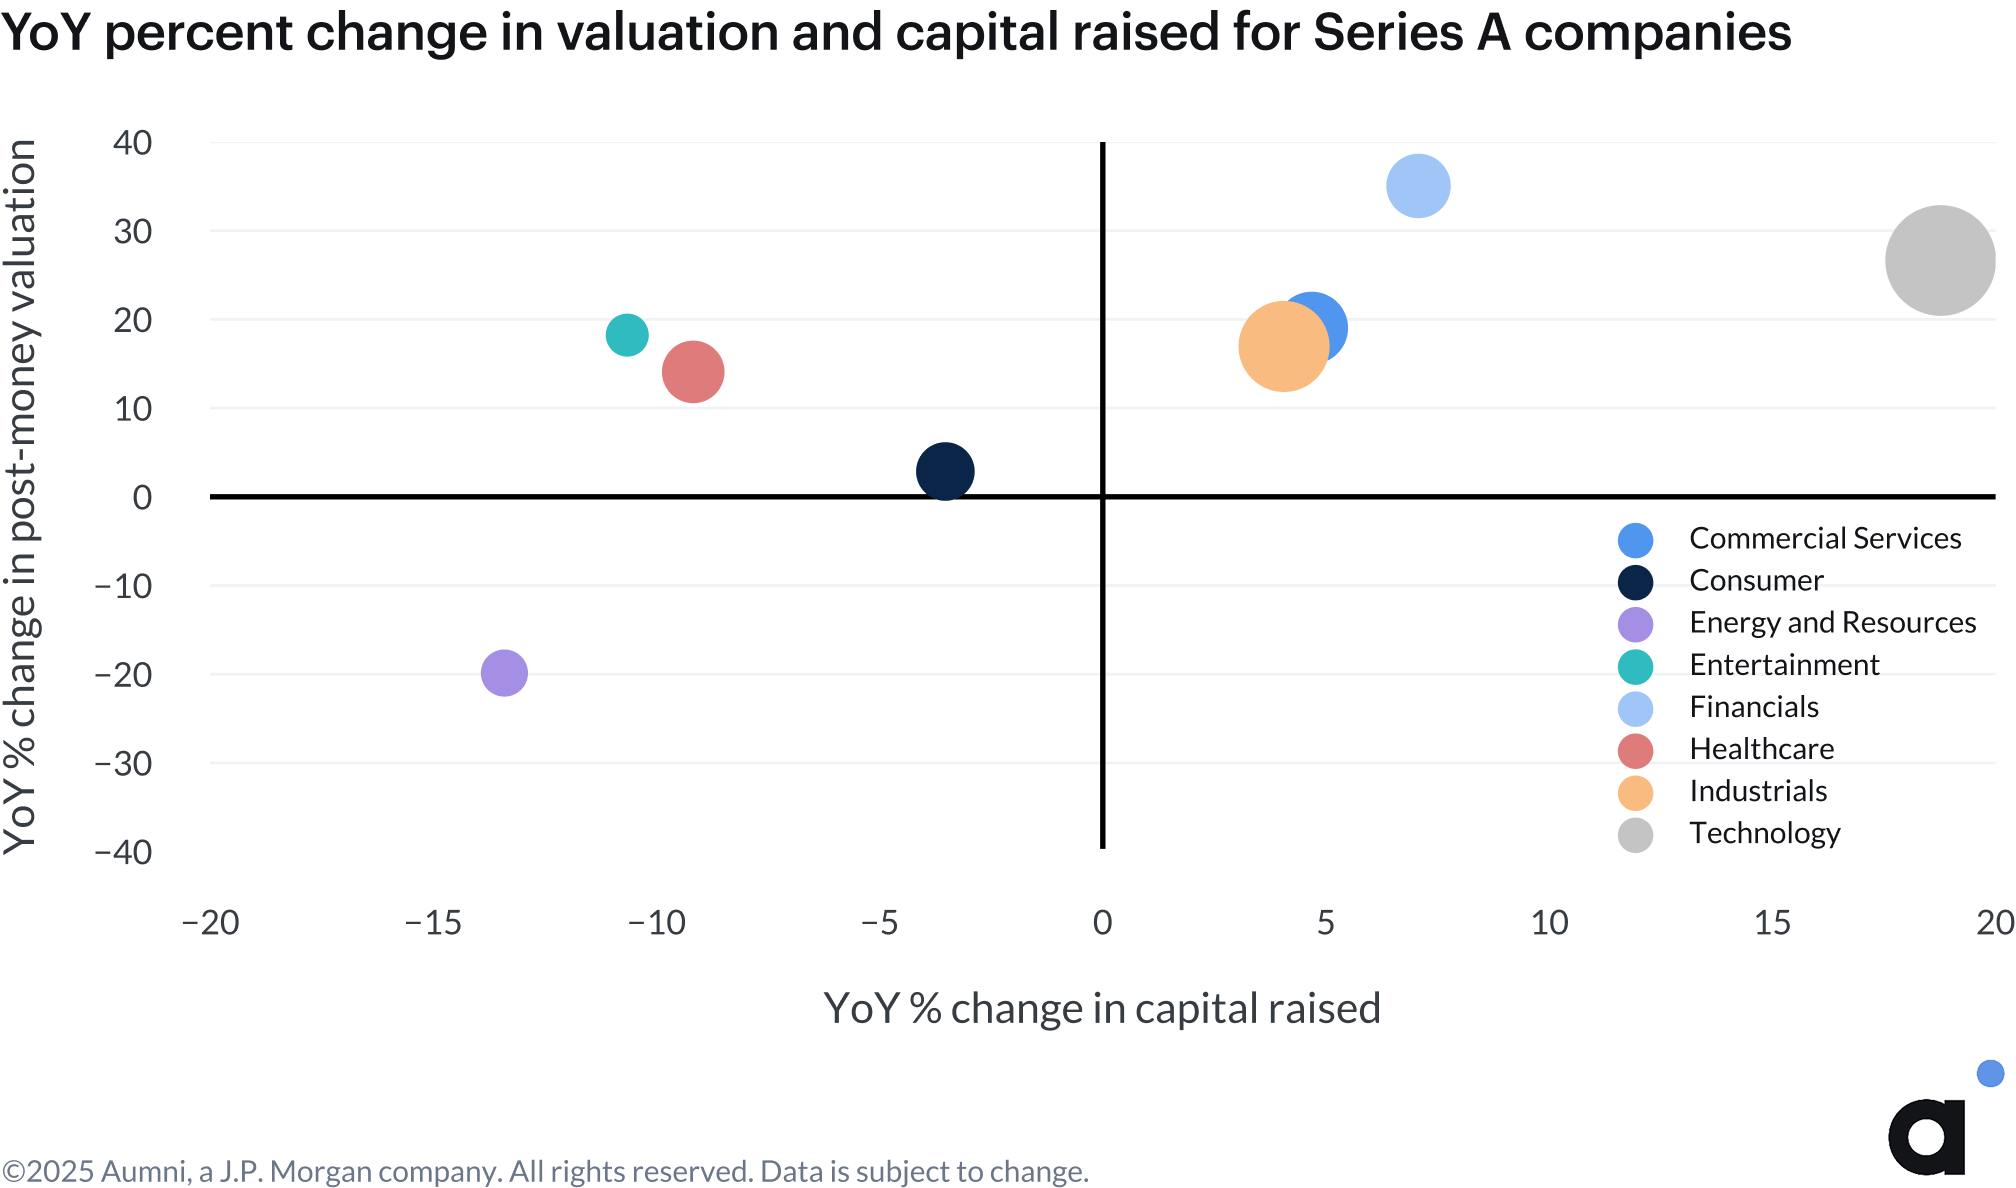
The scatter plot below shows the year-over-year percent change in post-money valuation and capital raised for Series A companies. Companies in the upper right quadrant saw increases in capital raised and valuation year-over-year, while companies in Energy and Resources in the lower left quadrant saw decreases. The data for the current year is measured from July 1, 2024 to June 30, 2025.
Artificial Intelligence
In Aumni’s taxonomy, Artificial Intelligence ("AI") is considered an applied technology, one that is applicable to any sector in the economy. AI is therefore a distinct category from “Sector.”
Valuation premiums for AI companies have remained strong through Q2 2025, with notable gaps between AI and non-AI companies at Series A in Industrials, Commercial Services, Healthcare, Financials, and Technology.
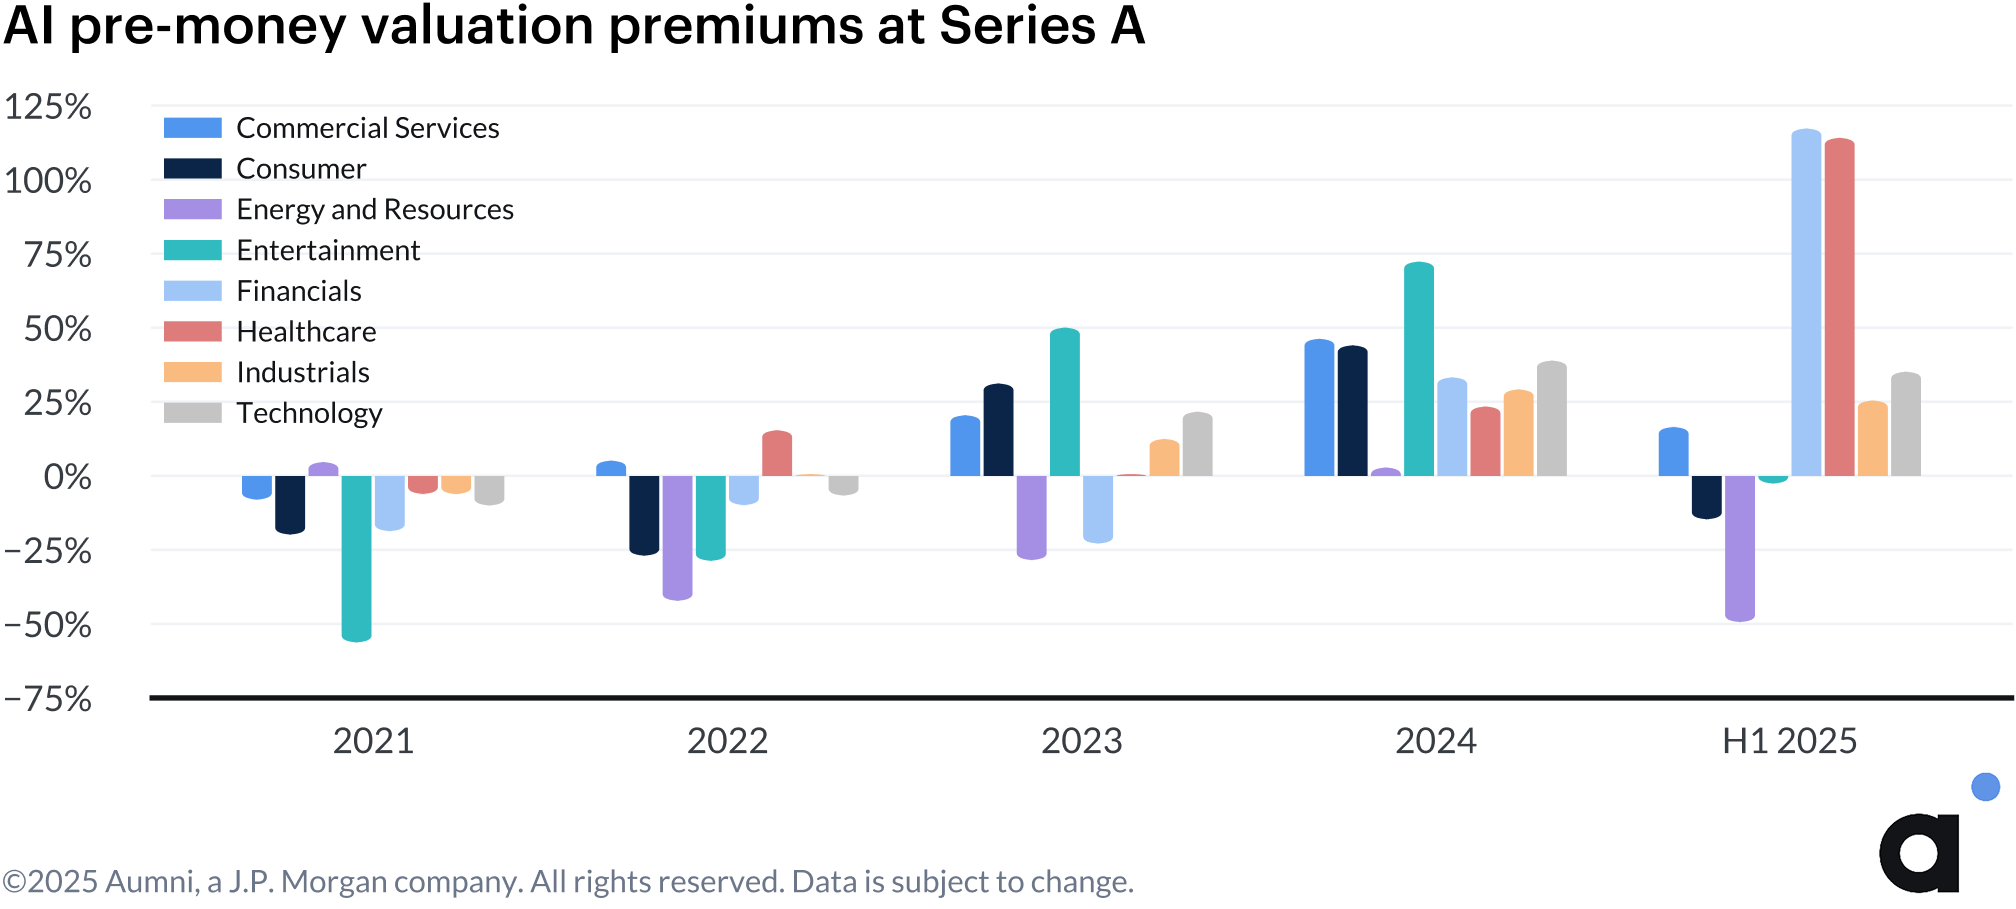
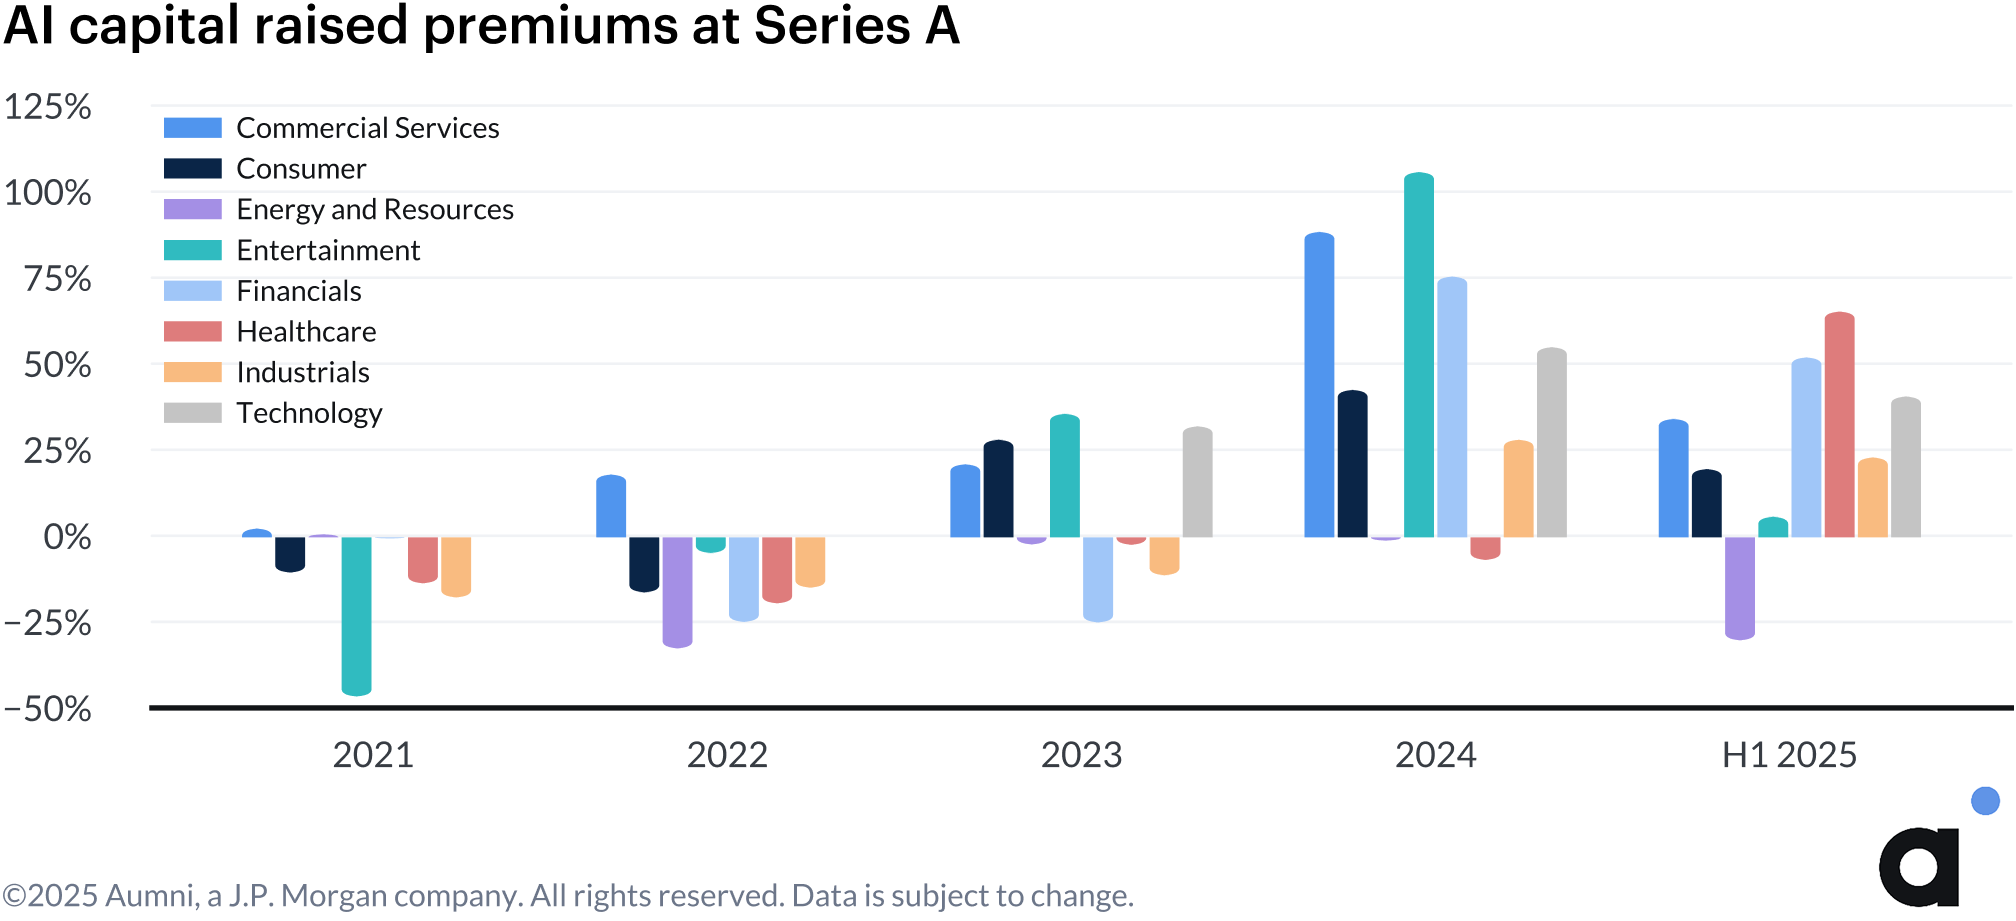
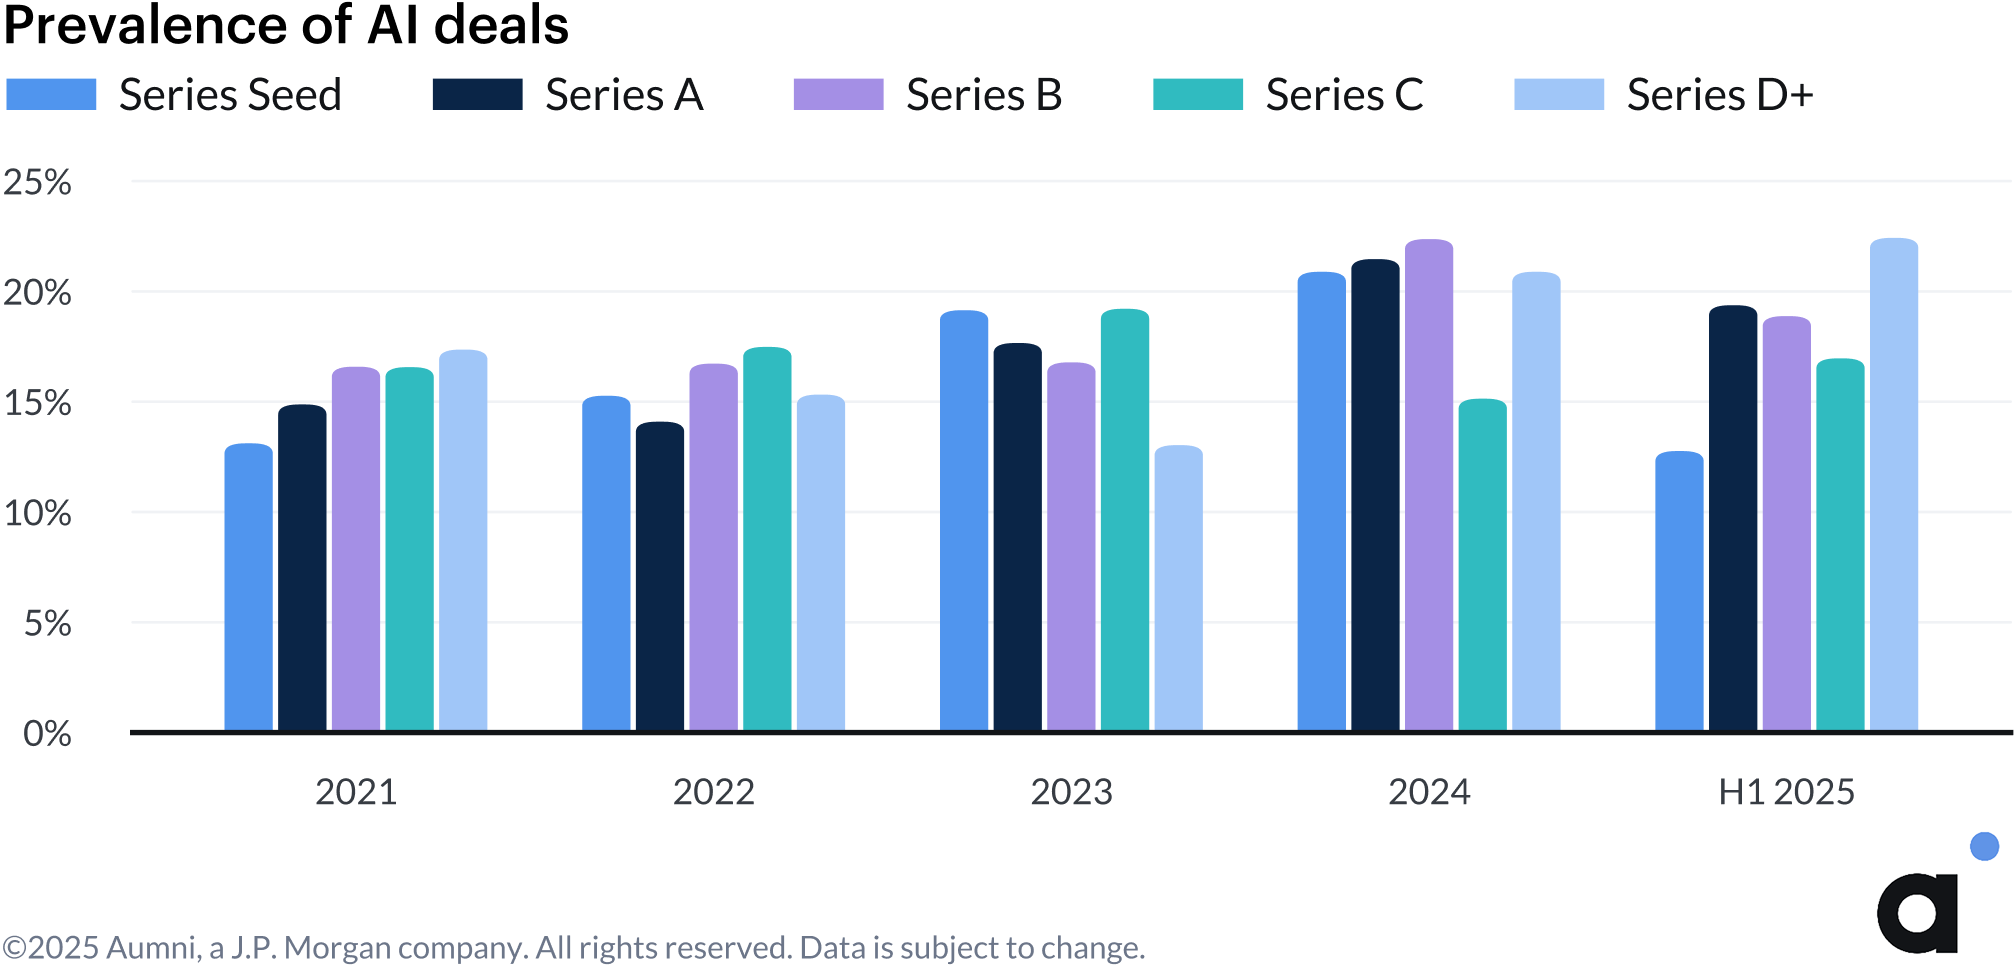
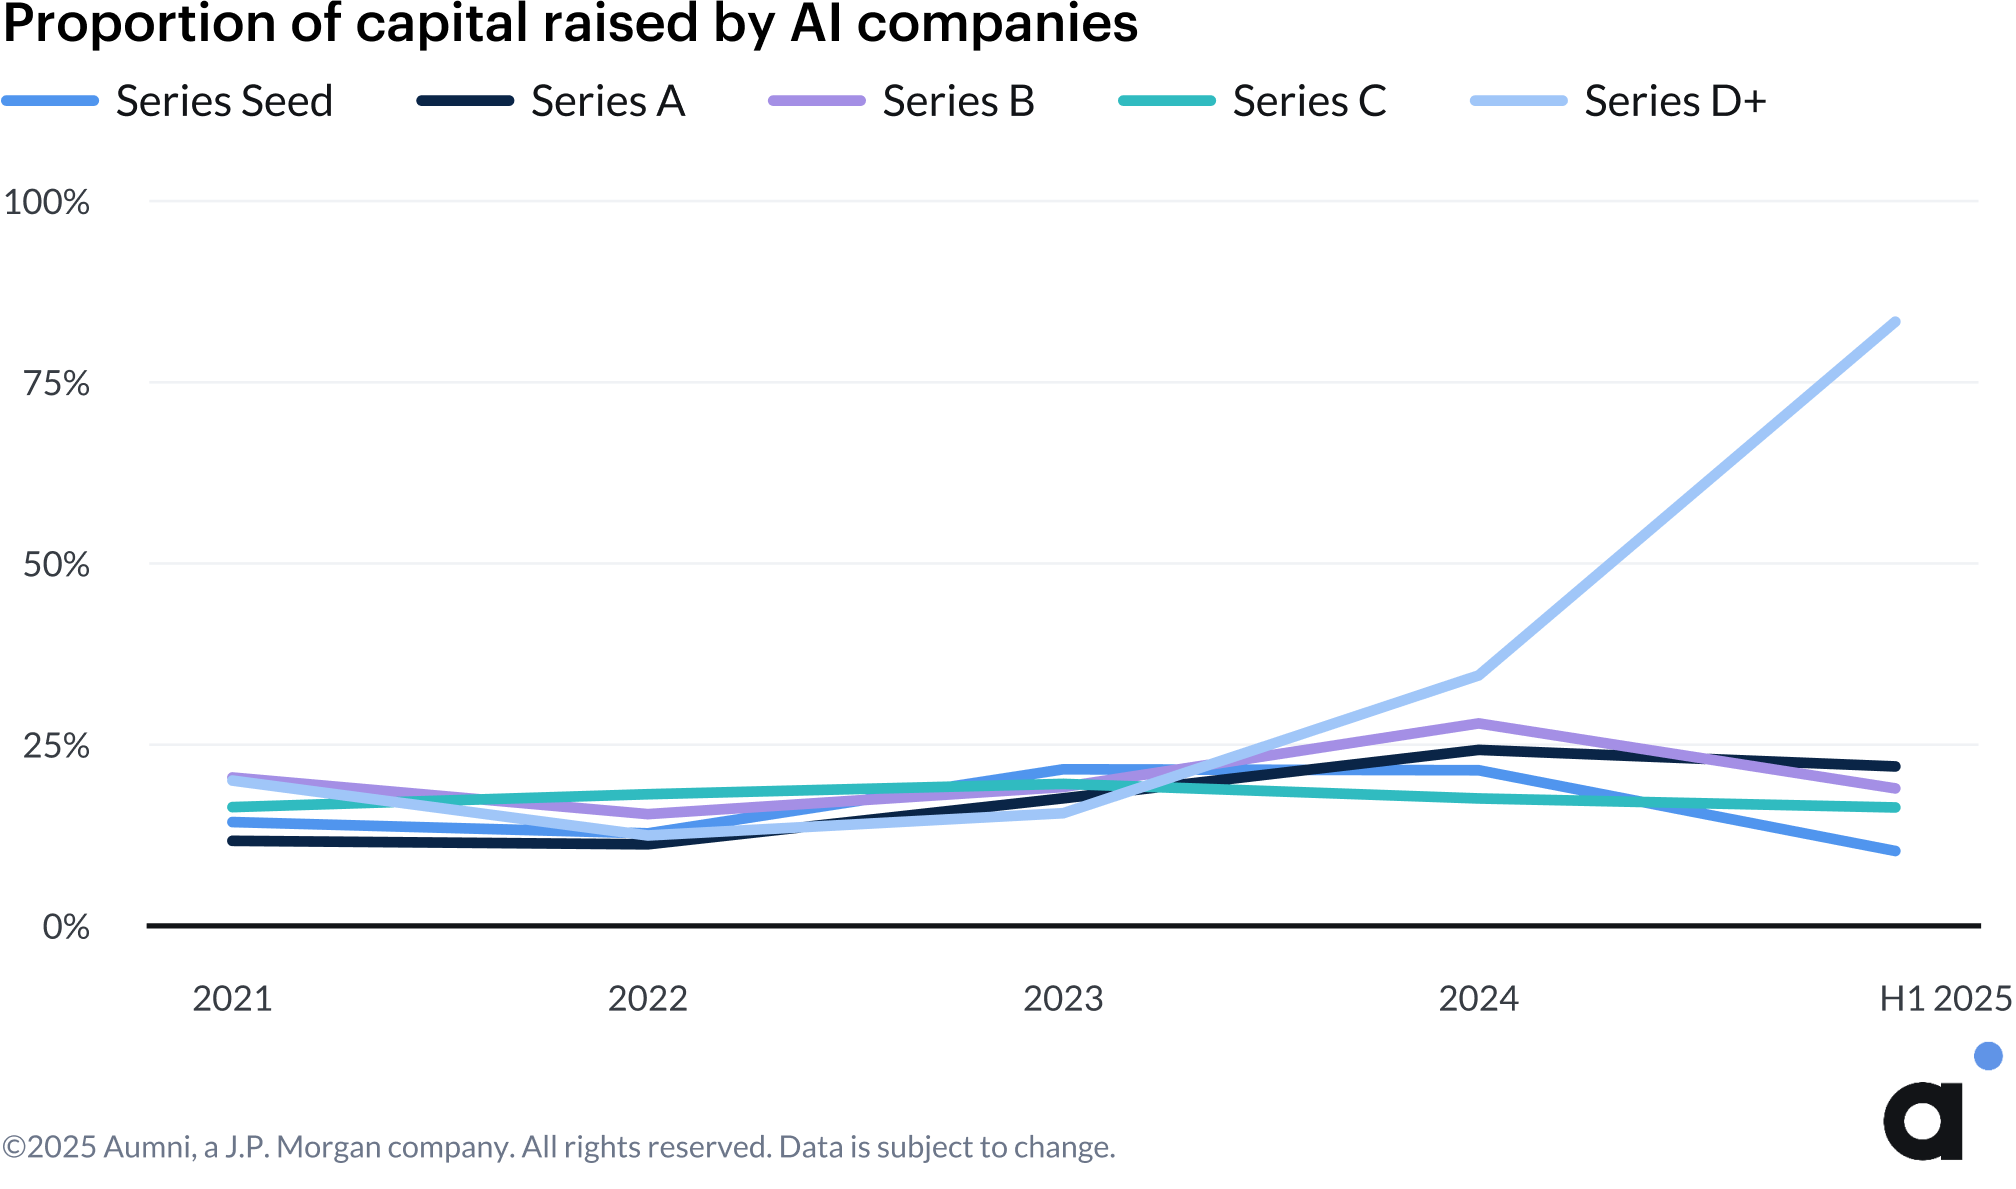
However, more complete deal data through Q2 reveals that AI representation across funding stages has plateaued or declined in the first half of the year. This trend extends to capital allocation, with AI deals capturing a reduced share of total funding—except in Series D+ rounds, which remain considerably elevated above 75% of capital deployed. These trends may reflect closer scrutiny of business models and investors being more selective in capital deployment.
Secondary Transactions
Secondary transaction volume in the first half of 2025 remains suppressed relative to the market peak in 2021, but is roughly on par with pre-pandemic levels and higher than the lows seen in 2023.
Beyond volume, the performance of venture-backed company shares on secondary markets has improved over the previous two years. 28.9% of secondaries in the first half of 2025 were purchased at a premium to the most recent equity financing round, compared to a low of 16.1% in the first half of 2023. That said, the average size of a secondary tranche remains subdued, hovering between $1.2M and $1.4M in the first half of 2025, suggesting that while sentiment has improved, investors remain cautious about transaction scale.
Methodology update:
We recently updated our methodology to reflect the difference between secondary transactions associated with an equity financing event and those that occur outside of the bounds of a financing round. The premium, par, discount chart below specifically evaluates secondary transactions that occur greater than 90 days after the date of an equity financing event as stated in the closing documents, up to four days before the date of the next capital raise. Secondary transactions that occur three days before and up to 90 days after the date of an equity financing event are considered “within round”, and are generally expected to trade at par.
A Secondary Tranche is an aggregation of multiple distinct transactions, where a single buyer purchases shares in a company from one or more parties, often a mix of founders, employees, and other investors. A secondary tranche represents a high-level view of a single purchaser’s intent to own shares in a given company. It does not explicitly include nor remove instances where a company is purchasing its own shares as a repurchase transaction, but our customers are primarily investors, so the data should reflect primarily secondary purchases by third parties.
Looking at company vintage, startups founded in 2020 are seeing the highest activity in secondary markets in 2025 in Aumni’s data, a trend that began in 2024. The increase in secondary transactions for companies founded in 2020 coincides with the typical four-year vesting period for employee options as well as the five-year QSBS holding period.
Equity Financing Dynamics
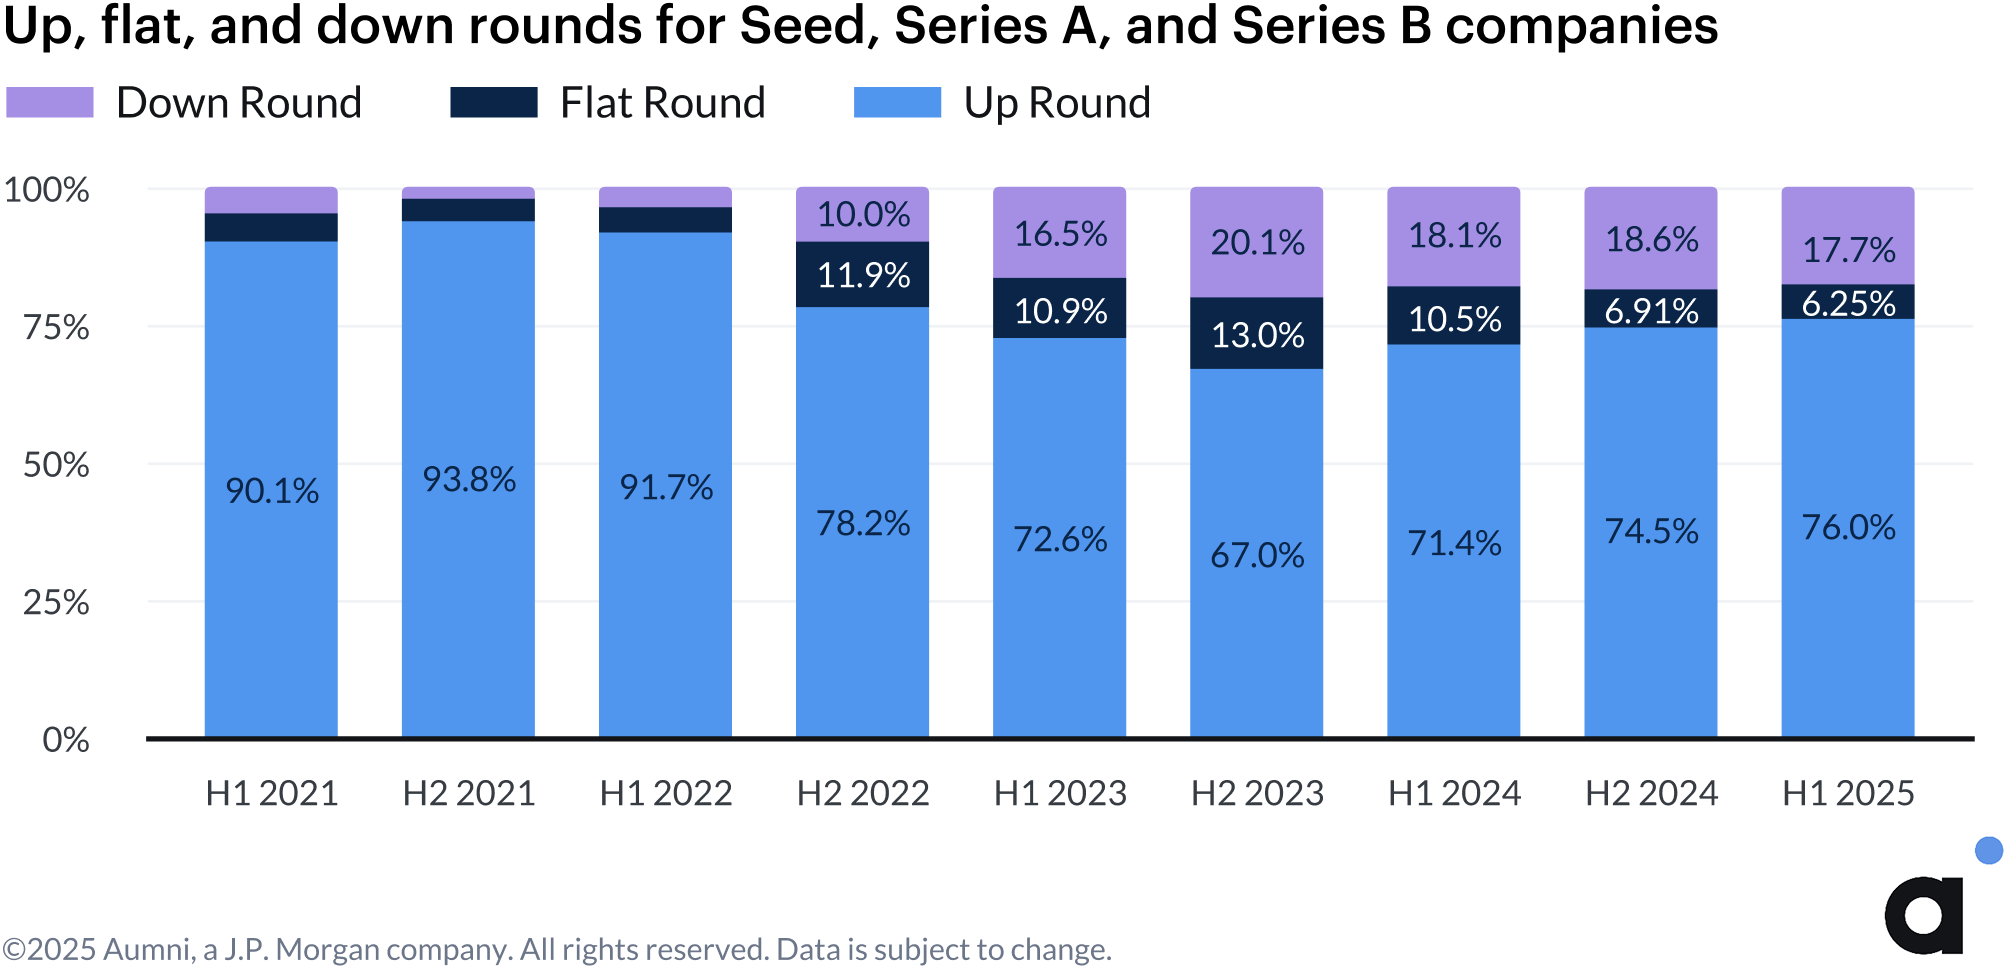
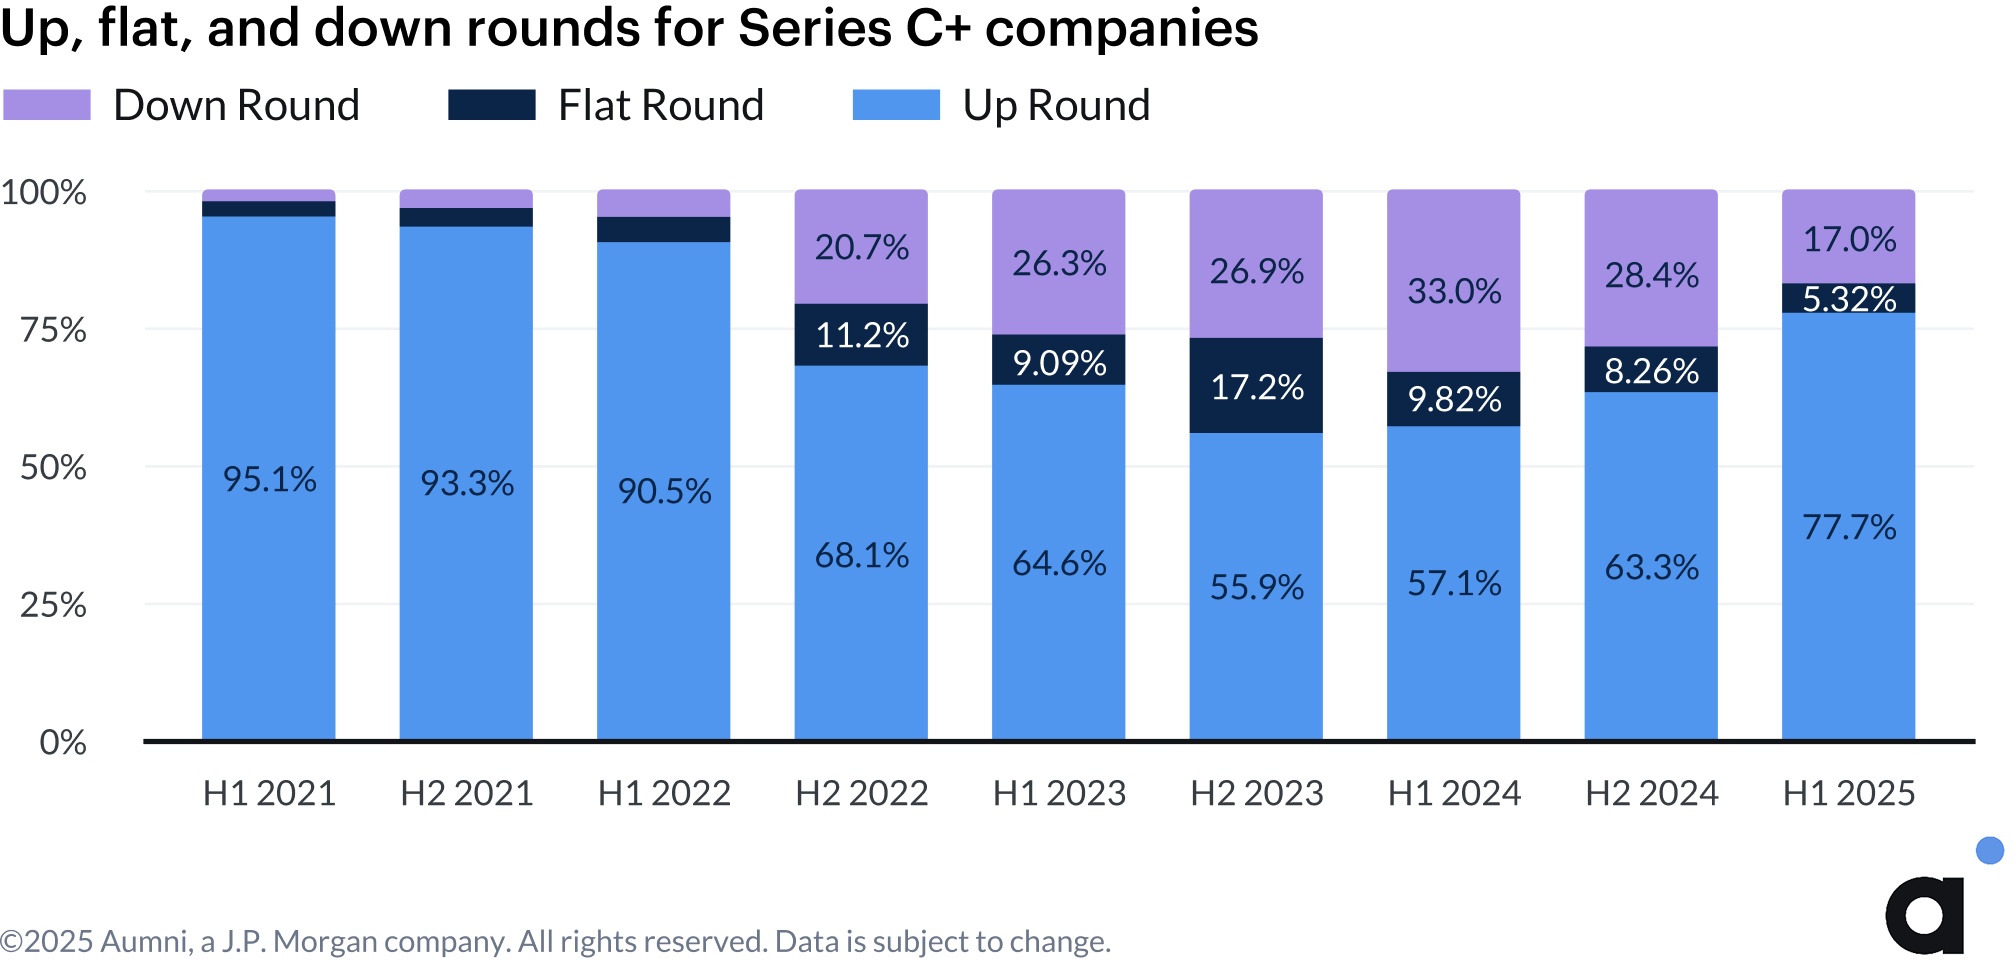
Down rounds declined across all funding stages in the first half of 2025. For Seed through Series B companies, down rounds dropped to 17.7% from 18.6% in H2 2024. The decline was more pronounced at later stages, with Series C+ down rounds falling from 28.4% in H2 2024 to 17% in H1 2025. The continued decline in the proportion of down rounds suggests the market has moved past the worst of the valuation reset that characterized 2022-2024.
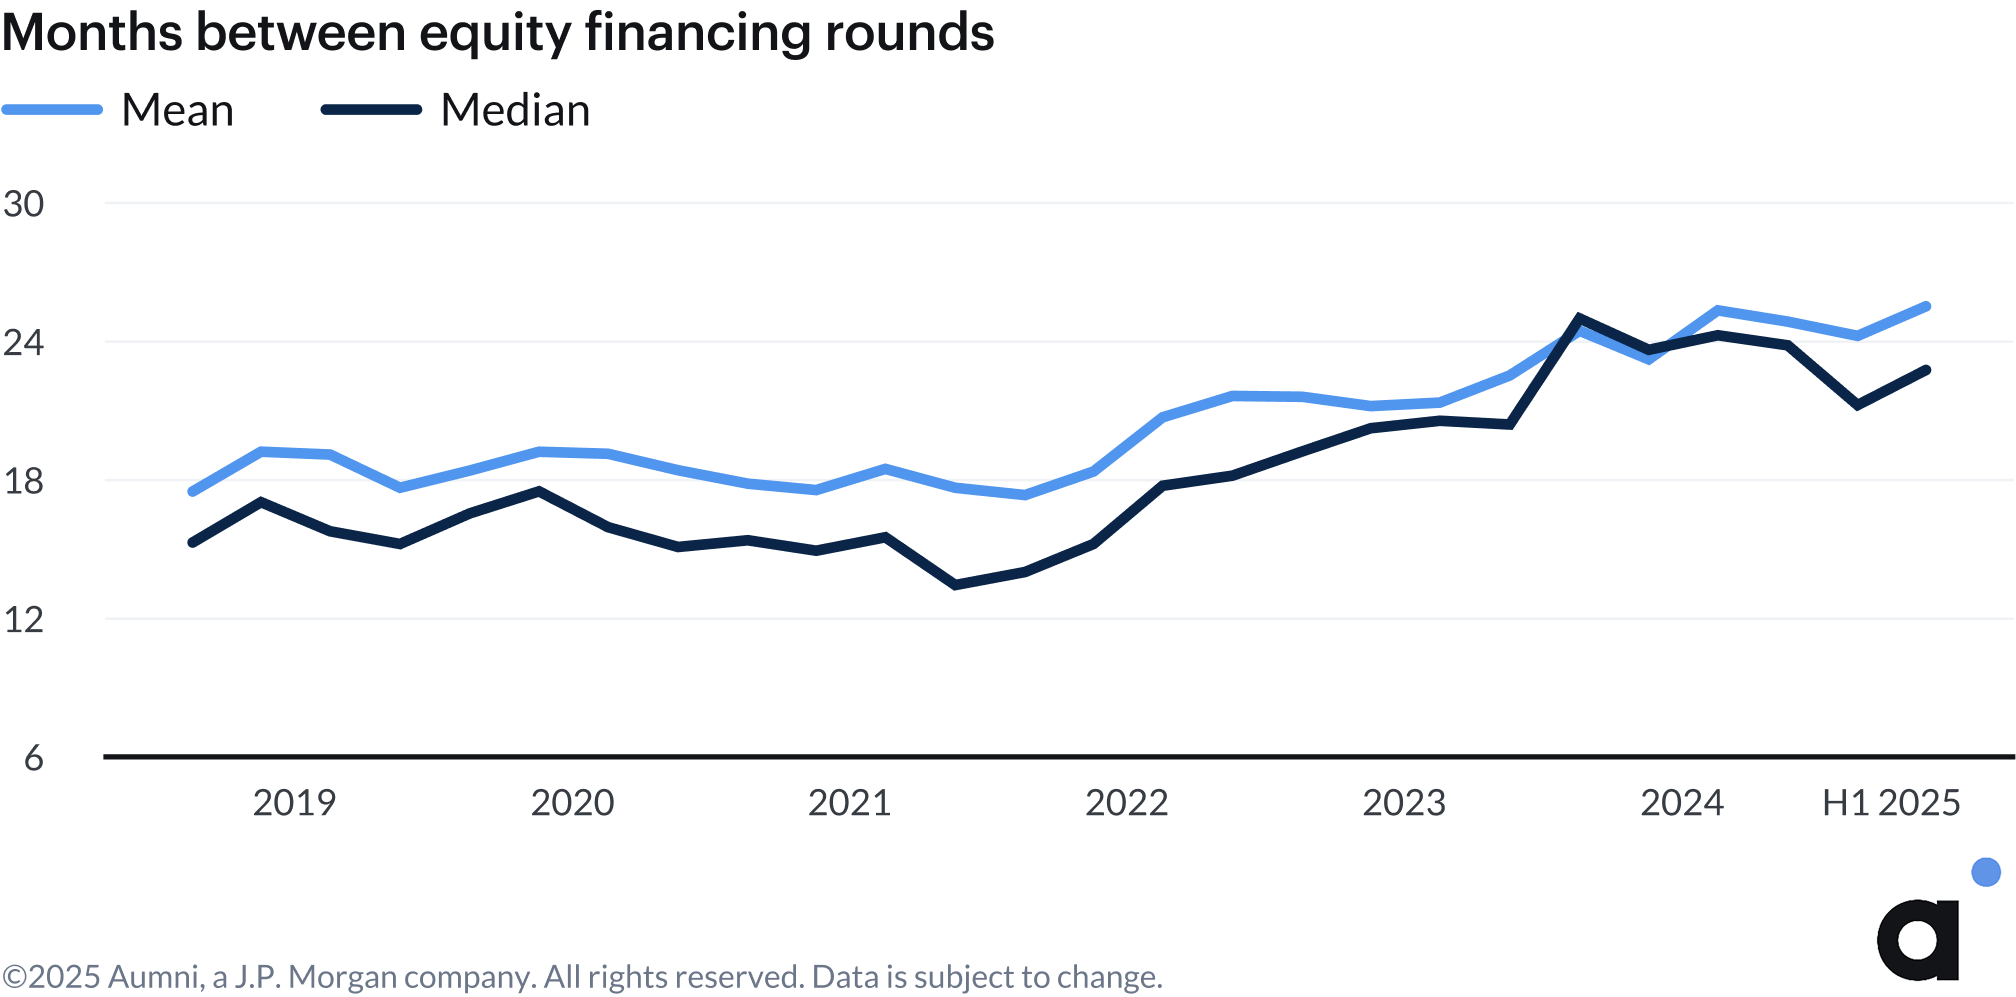
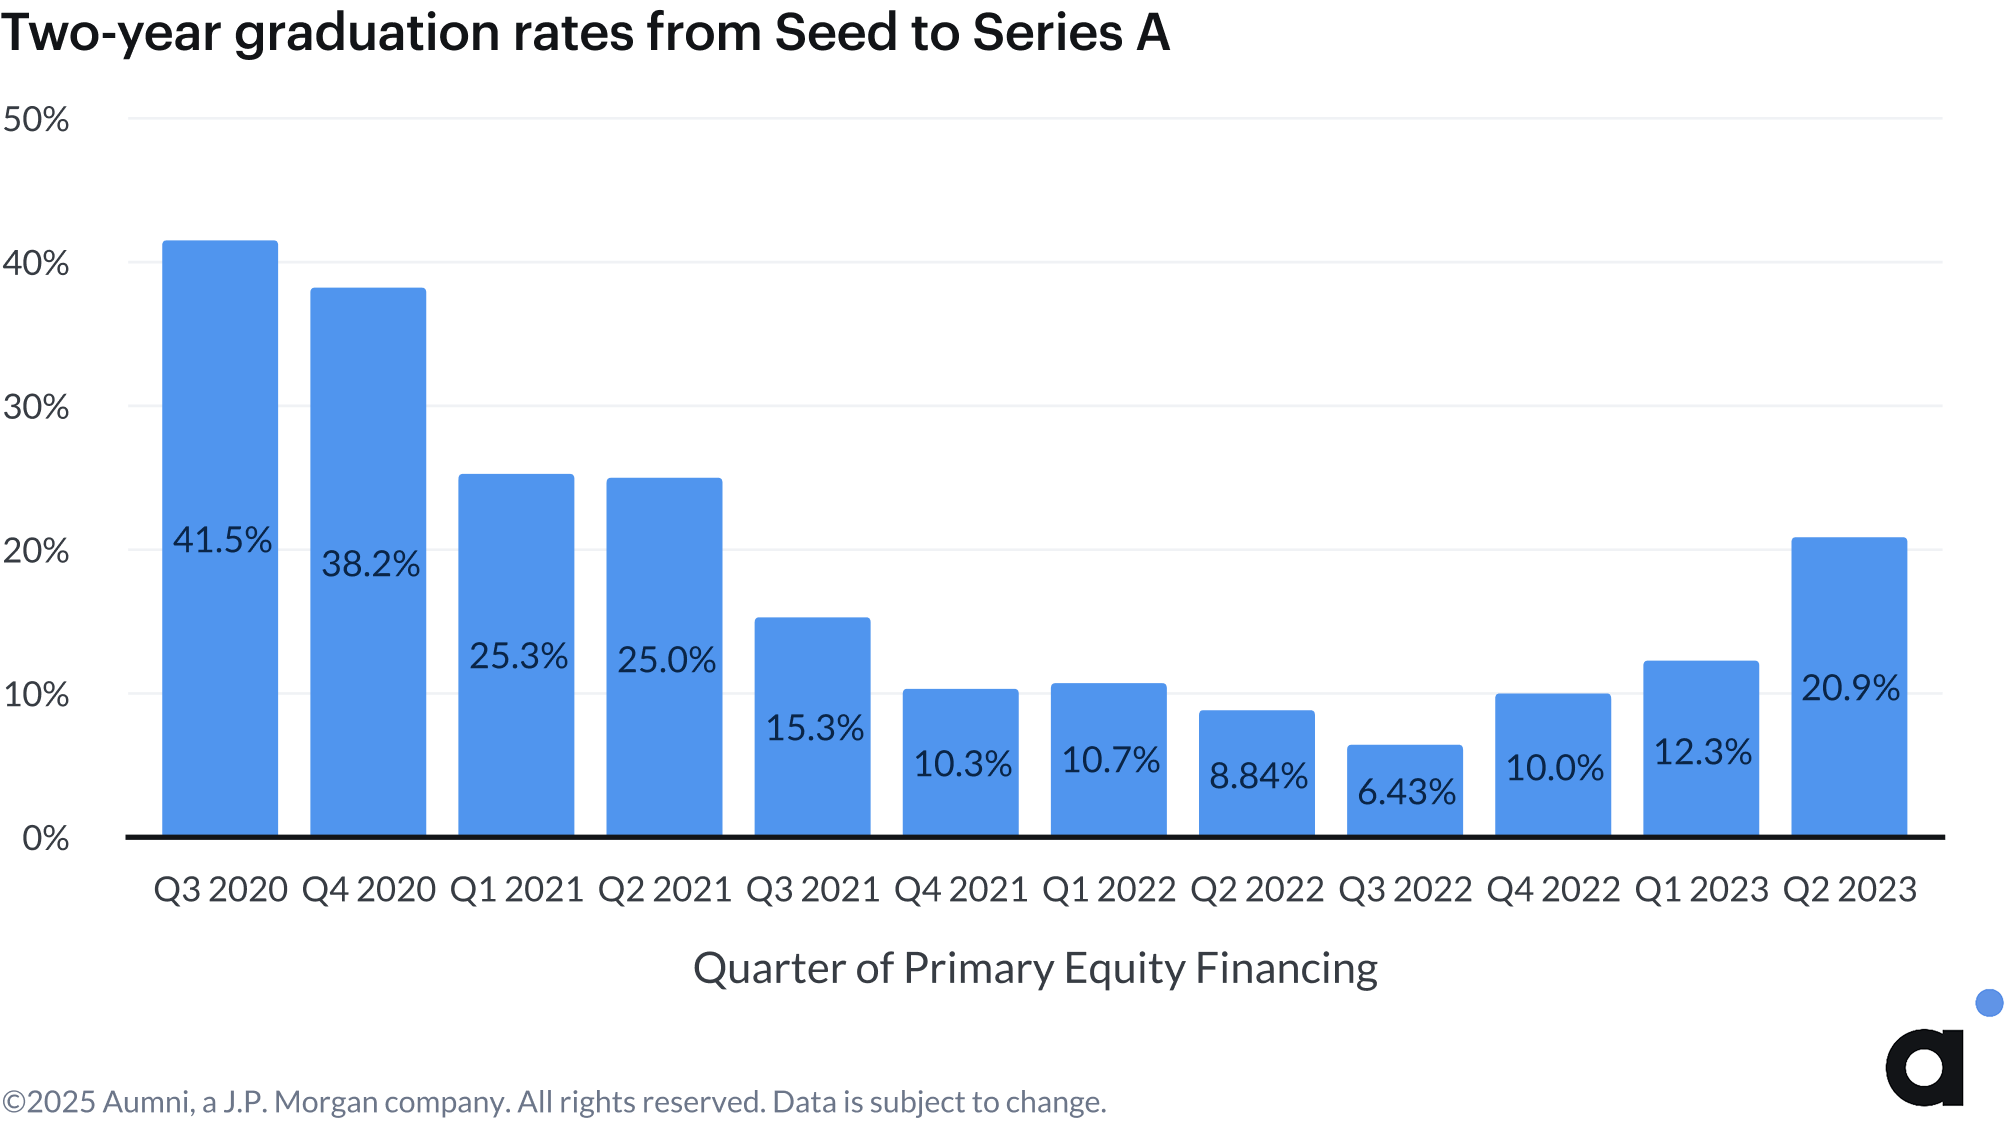
The positive momentum in fundraising timelines for companies raising capital reversed in Q2 2025, with the median time between rounds increasing to 23 months from 21 months in Q1 2025. Despite longer fundraising cycles, the Seed to Series A graduation pipeline is improving significantly in 2025. Among companies in Aumni’s dataset that raised a priced Seed round in Q2 2023, 21% successfully raised a Series A in the two years that followed. This is a sizable increase from the 6% of Seed stage companies in Q3 2022 that raised a Series A within two years.
Increased Use of Founder Preferred Stock
Founder preferred stock, a specialized stock class often designed to facilitate tax-efficient founder liquidity (often classified as “Series FF Preferred Stock”), within venture backed company documents, accelerated significantly in the first half of 2025. Founder preferred stock is often used by repeat founders who have greater sophistication on tax matters and may be less likely to face resistance from investors who prefer simpler equity structures.
The increasing adoption of founder preferred stock continues a trend that began in 2024. Founder preferred stock was present in nearly 11% of companies at the time of their priced equity financing events in the first half of 2025, reflecting an increase from approximately 9% in 2024 and 6% in 2023.
SAFEs and Convertible Notes
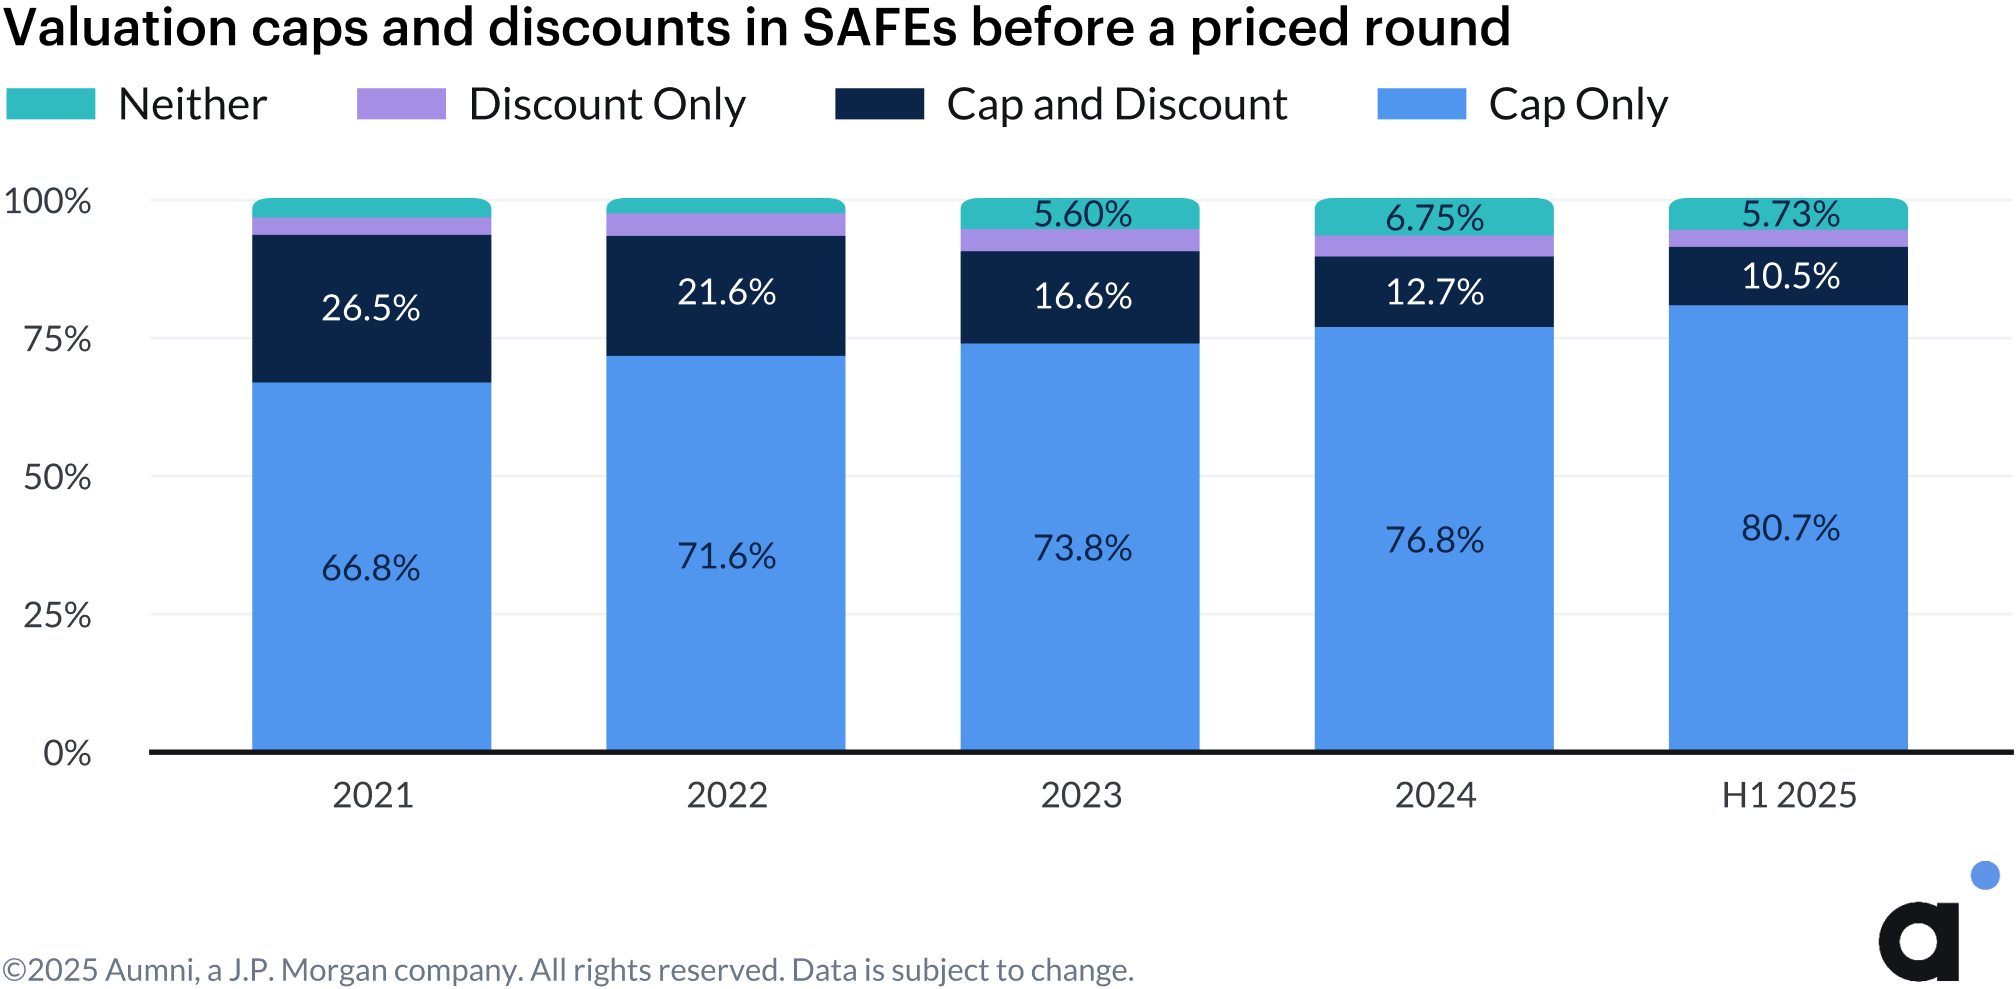
SAFEs continue to dominate pre-seed investments, increasing to 91.8% in Q2 2025 from a low of 76.2% in Q4 2023. Cap-only SAFEs in particular remain the dominant structure for investments in pre-seed companies, as Cap and Discount SAFEs continue to decline in prevalence, decreasing from 13% in 2024 to 10% in the first half of 2025.
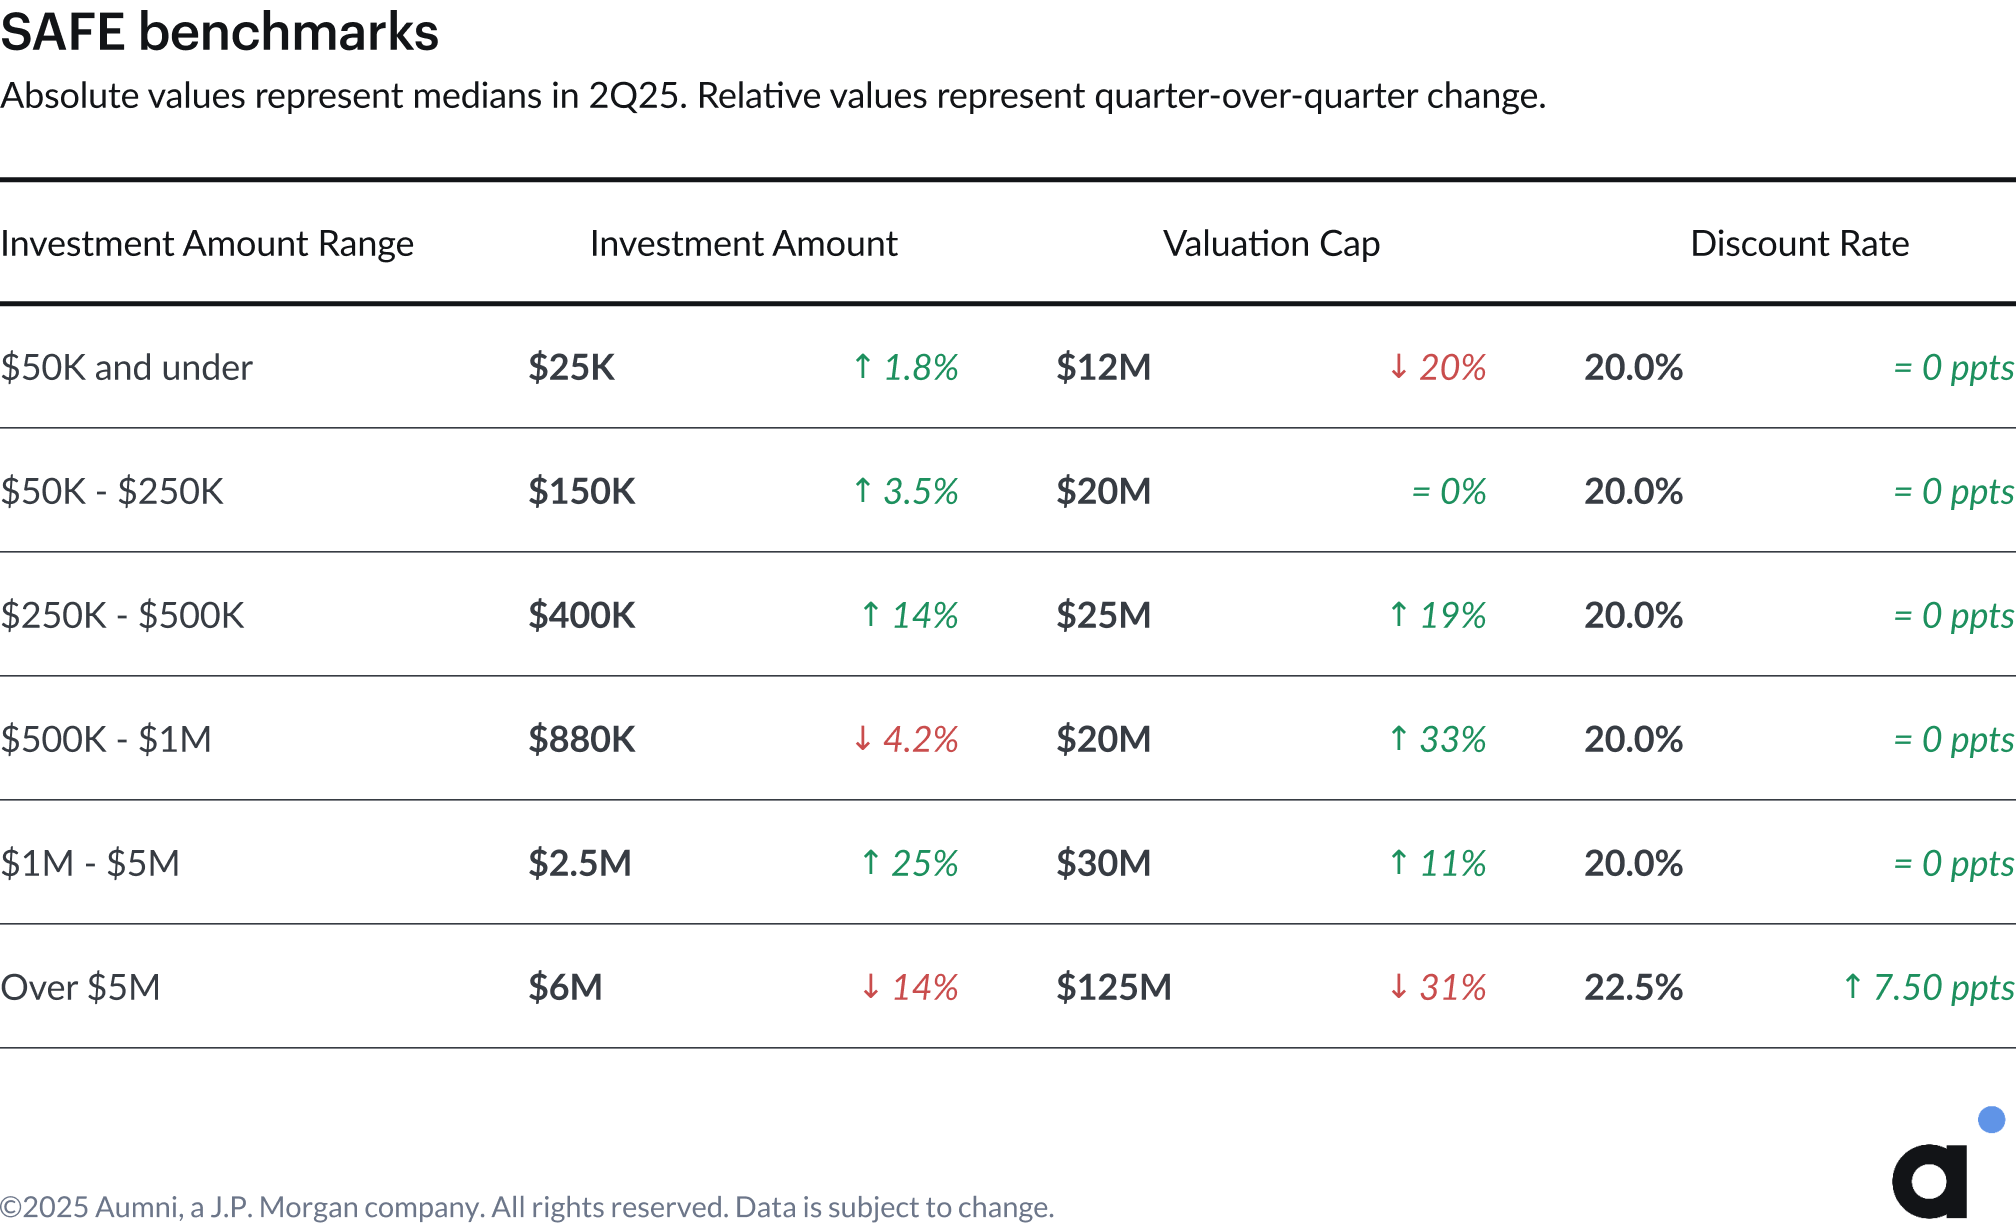
Investment amounts and valuation caps in SAFEs varied significantly by deal size in Q2 2025, with both small and large transactions showing notable declines. For smaller SAFEs of $50K and under, median valuation caps declined by 20% quarter-over-quarter while investment amounts held steady. At the other extreme, investment amounts for SAFEs over $5M declined by 14% quarter-over-quarter, with valuation caps declining by over 30%. Improving valuation caps for SAFE investments outside of the $50K and under and $5M+ range may indicate an improved fundraising environment for startups and greater investor competitiveness in rounds.
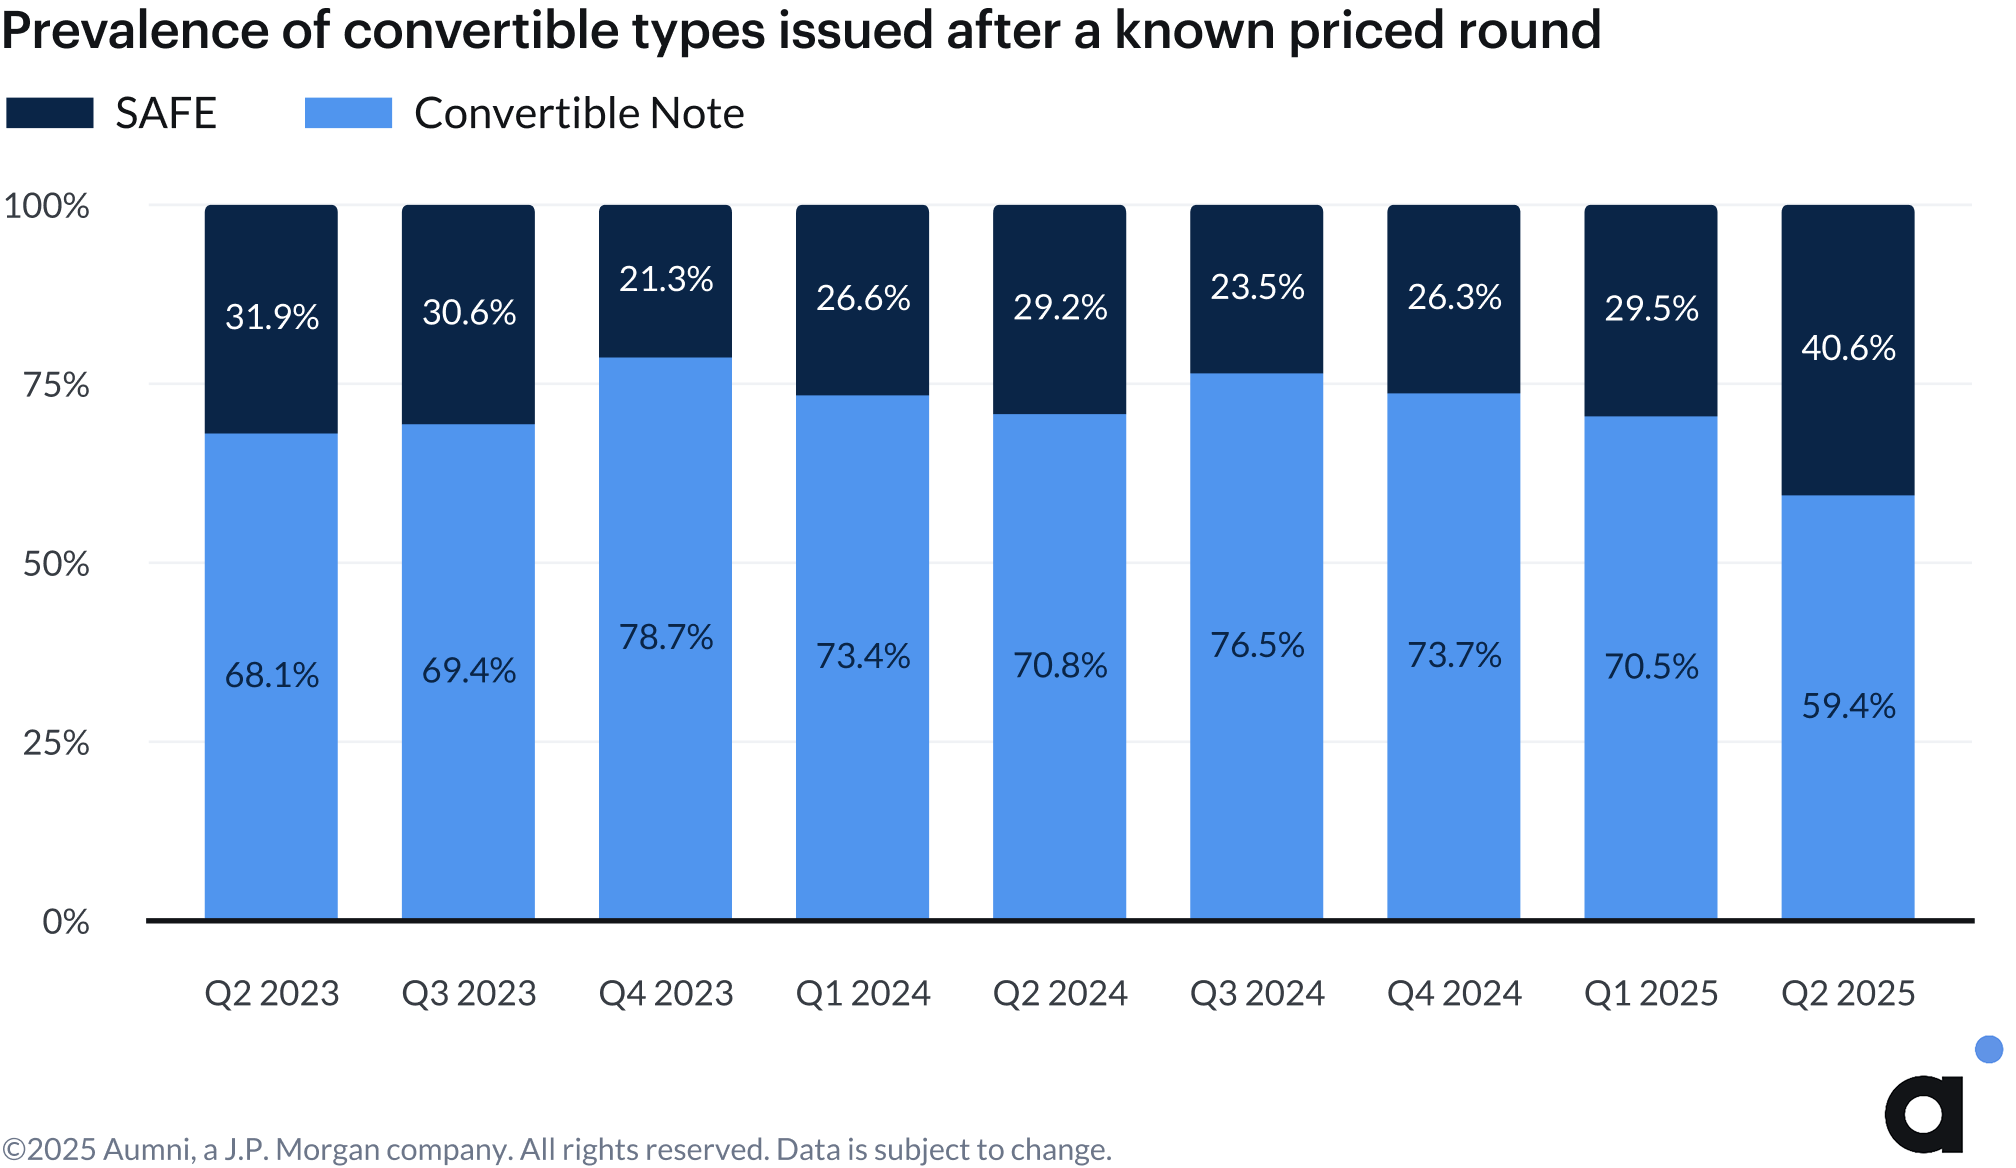
Convertible notes remain more prevalent after priced equity rounds but are losing ground, with their market share declining to 59.4% in Q2 2025 from 70.5% in Q1.
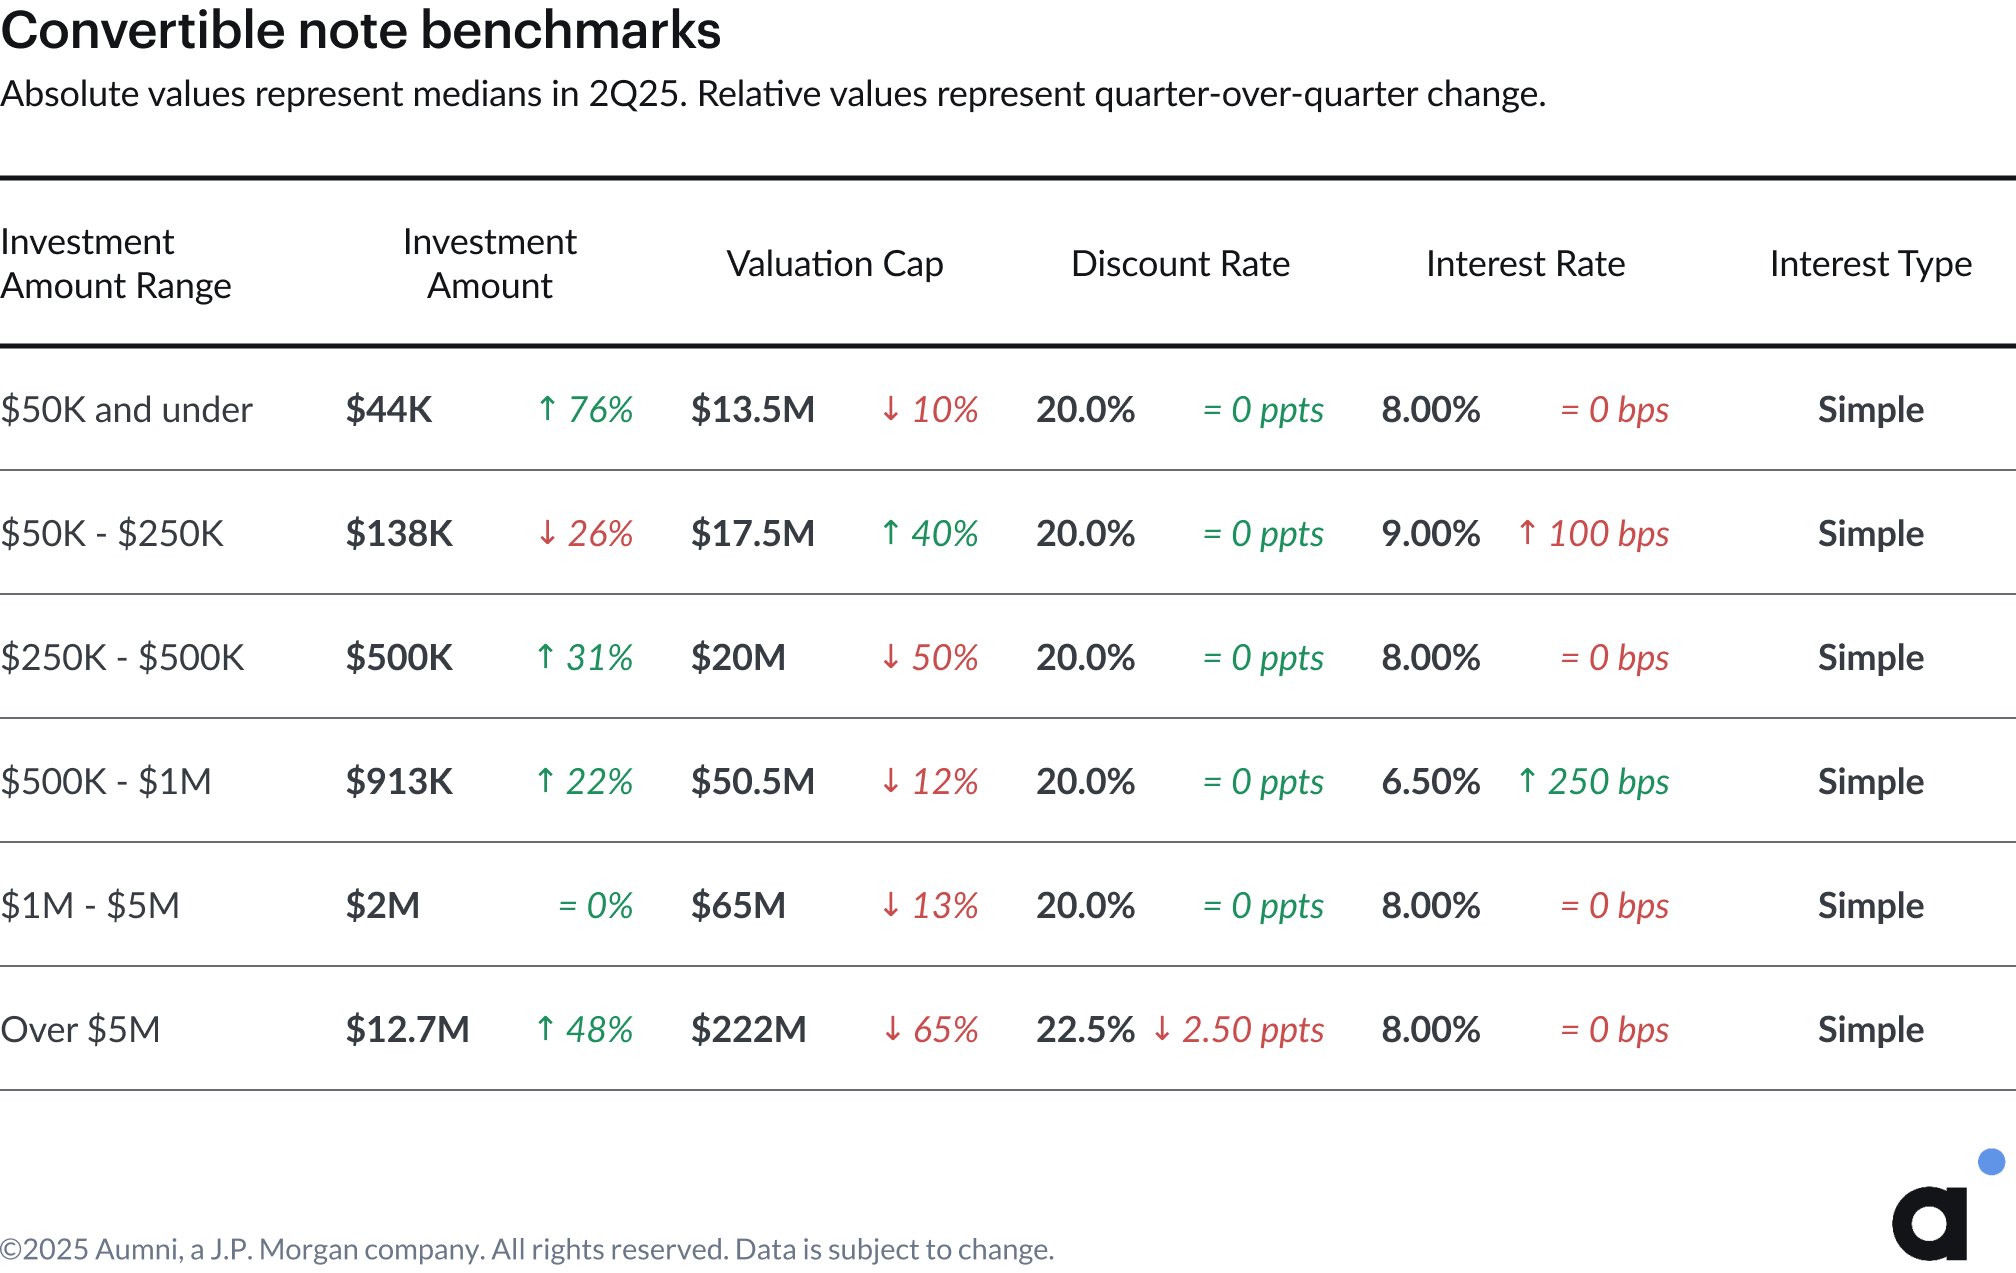
Valuation caps for convertible notes declined across most deal sizes in Q2, with the largest decline for notes over $5M at 65% quarter-over-quarter. Declining valuation caps in convertible notes, which stands in contrast to SAFEs, may reflect investor caution as evidenced by the use of the note structure, which is often seen as more protective for investors than SAFEs, and thus may be used in true bridge financing scenarios for companies waiting to complete an equity fundraise.
Discount rates for both SAFEs and convertible notes remained largely unchanged in Q2, with notable exceptions in opposite directions for notes and SAFEs over $5M.
Final Remarks
The venture capital market in H1 2025 reveals a continued reconfiguration of funding stages, with Seed rounds adopting Series A characteristics as companies raise larger amounts to bridge persistently long fundraising cycles. Adjustments may also reflect companies needing more time, and therefore more money, to hit the milestones and benchmarks expected by investors for Series A companies.
The near-doubling of founder preferred stock incidence since 2023 signals that proven entrepreneurs are conscientious of liquidity outcomes, even as overall market selectivity increases. AI companies exemplify this selectivity, maintaining strong valuation premiums despite capturing a reduced share of total funding outside of Series D+ rounds. Quality companies in secondary markets reflect this same dynamic, with over 28% of transactions trading at premiums, though subdued tranche sizes suggest cautious optimism rather than renewed confidence.
The decline in down rounds across all stages, combined with extended fundraising timelines, suggests that while the market has found more stable footing, the bar for accessing capital has clearly risen.
Thank you to all colleagues at Aumni and partners at Fenwick for their contributions to this edition of the Venture Beacon.

Venture firms, corporate VCs, fund admins, and law firms all rely on Aumni to manage their venture documents, report on portfolio company KPIs, obtain valuations, benchmark terms, model scenarios, and more.
Aumni is here to help you do venture right. Speak with an expert:
Methodology
Data Sources
Aumni obtains primary data from third parties, including law firms, angel investors, VC firms, CVC firms, institutional investors, and others. All data contained in this report pertains to companies with jurisdiction in the United States and is aggregated from an anonymized database of source data. All data is de-identified prior to analysis by our research team.
Definitions
- Artificial Intelligence Company – A company that develops or employs artificial intelligence technology in their business model and/or product offering.
- Capital Raised – The total sum of new money raised in an equity financing round.
- Commercial Services Sector – Companies operating in the Commercial Services space.
- Consumer Sector – Companies operating in the Consumer Goods or Services space.
- Convertible After a Known Priced Round – Issuance of a convertible note or SAFE after a known equity financing event.
- Convertible Before a Known Priced Round – Issuance of a convertible note or SAFE before a known equity financing event.
- Convertible Note – A short–term debt instrument that converts into equity.
- Convertible Note Interest Rate – The interest rate at which a convertible note’s principal will accrue interest over time.
- Convertible Note/SAFE Purchase Amount – The dollar value of an investment in a Convertible Note or SAFE.
- Corporate Jurisdiction – The state of incorporation for a legal entity. The location where the entity formed and registered its articles of incorporation.
- Dilution – The percentage decrease in ownership of a company due to the issuance of new shares.
- Discount – The discount a Convertible Note or SAFE holder receives on the share price relative to subsequent investors during the conversion of the security in an equity financing round.
- Down Round - A financing event in which a company obtains a new pre-money valuation equal to or less than 95% of the post-money valuation of the previous financing round.
- Early Stage – Early stage comprises Series Seed, Series A, and Series B transactions.
- Energy and Resources Sector – Companies operating in the Energy, Environment, or Natural Resources space.
- Entertainment Sector – Companies operating in the Media, Entertainment, or Recreation space.
- Financials Sector – Companies operating in the Finance, Real Estate, or Insurance space.
- Flat Round - A financing event in which a company obtains a new pre-money valuation between 95% and 105% (exclusive) of the post-money valuation of the previous financing round.
- Founder Preferred Stock – A specialized stock class often designed to facilitate tax-efficient founder liquidity (often classified as “Series FF Preferred Stock”).
- Healthcare Sector – Companies operating in the Healthcare or Life Sciences space.
- Industrials Sector – Companies operating in the Aerospace, Manufacturing, or Industrials space.
- Investment Amount Range – Categories that group convertible notes and SAFEs according to the amount of capital invested in a given company by a distinct investor.
- Late Stage – Late Stage comprises Series C and later transactions.
- Lead Investor – The legal entity identified as the lead investor in an equity financing or the one that purchased the largest number of shares.
- Post-Money Valuation – The enterprise value of a portfolio company following the closing of an Equity Financing, calculated as the fully diluted share count of a company multiplied by the highest new money original issue price of any equity class issued in an equity financing.
- Pre-Money Valuation – The determined value of a company, usually via a 409A valuation, prior to the closing of an equity financing round.
- Priced Equity Round – A financing event where a company raises capital from institutional investors at a set price per share based on the fair market value determined through an independent 409a valuation.
- Primary Round – The first priced equity round of a specific class in the traditional venture capital sequence (Series Seed, Series A, Series B, etc.).
- Qualified Financing – A financing event that meets pre-determined criteria and triggers the conversion of convertible securities into equity ownership of the company.
- Secondary Premium, Par, Discount – Categories for secondary transactions that indicate whether the price per share paid in the transaction was at a value above (premium), the same as (par), or below (discount) the share price associated with the most recent priced equity round. The calculation evaluates secondary transactions that occur greater than 90 days after the date of an equity financing event as stated in the closing documents, up to four days before the date of the next capital raise.
- Secondary Tranche – An aggregation of multiple distinct transactions, where a single buyer purchases shares in a company from one or more parties, often a mix of founders, employees, and other investors. A secondary tranche represents a high-level view of a single purchaser’s intent to own shares in a given company.
- Series C+ – All priced equity rounds named Series C or later are grouped into Series C+.
- Series D+ – All priced equity rounds named Series D or later are grouped into Series D+.
- Simple Agreement for Future Equity (SAFE) – A convertible security that allows investors to buy shares in a future-priced equity round.
- Technology Sector – Companies operating in the Information Technology space.
- Up Round – A financing event in which a company obtains a new pre-money valuation equal to or greater than 105% of the post-money valuation of the previous financing round.
- Valuation Cap – A price ceiling at which a SAFE or Convertible Note will convert to stock ownership in the event of a Qualified Financing.
- Vintage Year – The year a company is founded.
Methods and Calculations
- Indexed Values to Base Period – The relative change in a value, where the initial value in a base period is set to 100, and all subsequent changes reference this initial value.
- Series Stages – Series A through D+ stage names are based on the legal name of the round and are inclusive of shadow rounds, e.g., Series A is inclusive of Series A-1.
- Stage-to-Stage Two Year Graduation Rate Cohorts – The proportion of companies that raise additional financing of the next class in the traditional venture capital sequence (Series Seed, Series A, Series B, etc.) within two years of a primary priced equity round.
- Time between Rounds – The length of time, measured in months, between two sequential equity financing events for a given company. The final output is a median or a mean across all companies per quarter.